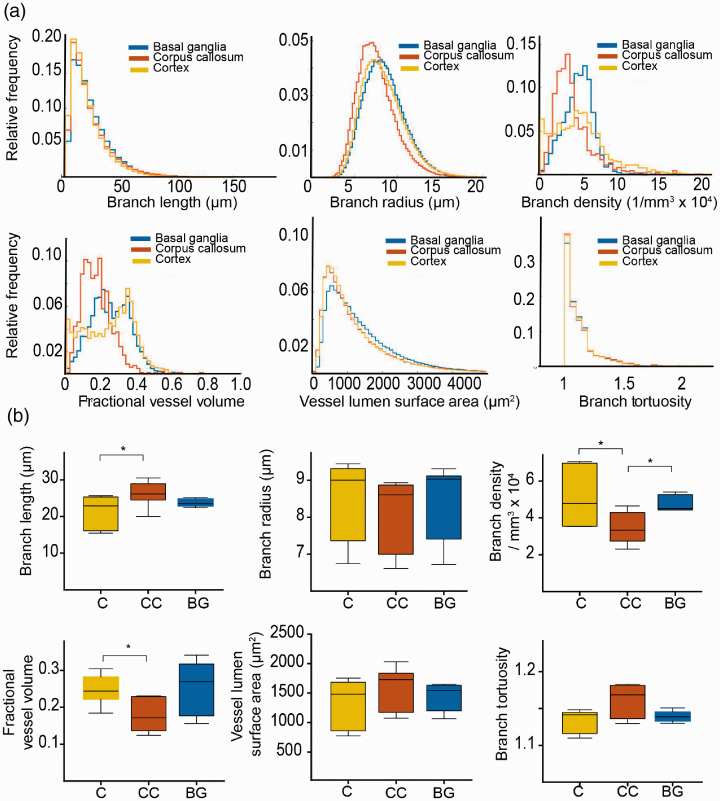
Figure 2.
Microvascular parameters in the healthy mouse brain. (a) Histograms show quantification results from ultramicroscopic images and demonstrate significant differences between the indicated vessel parameters in different regions of the healthy brain. (b) Whisker plots demonstrate vessel parameters of different regions in the healthy brain (median with 50% quantile and extremal values (whiskers) from n = 3 mice for six analyzed brain hemispheres. * =p<0.05.
C: cortex; Cc: corpus callosum; BG: basal ganglia.

