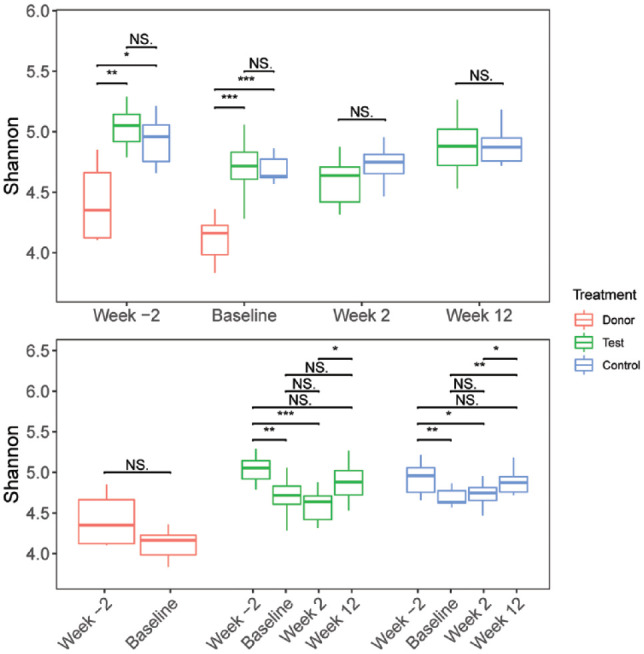
Figure 2.

Changes in the alpha-diversities of the oral microbiota in the donor, test, and control groups throughout the study. The levels of species diversity (as determined by Shannon entropies) in the respective sets of test (green) and control (blue) oral microbiota samples were evaluated at the week –2, baseline, week 2, and week 12 time points. The median, upper and lower quartile values, and ×1.5 interquartile ranges are indicated. The corresponding levels of species diversity of the single healthy donor dog oral microbiota samples were evaluated at the week –2 and baseline time points (red). Statistically significant differences were inferred by the Wilcoxon signed-rank test at P value cutoffs: *P ≤ 0.05, **P ≤ 0.01, and ***P ≤ 0.001. NS, no significant difference. The 2 panels illustrate the results of different statistical comparisons between (upper panel) and within (lower panel) the respective sets of test, control, and donor subjects at the various time points.
