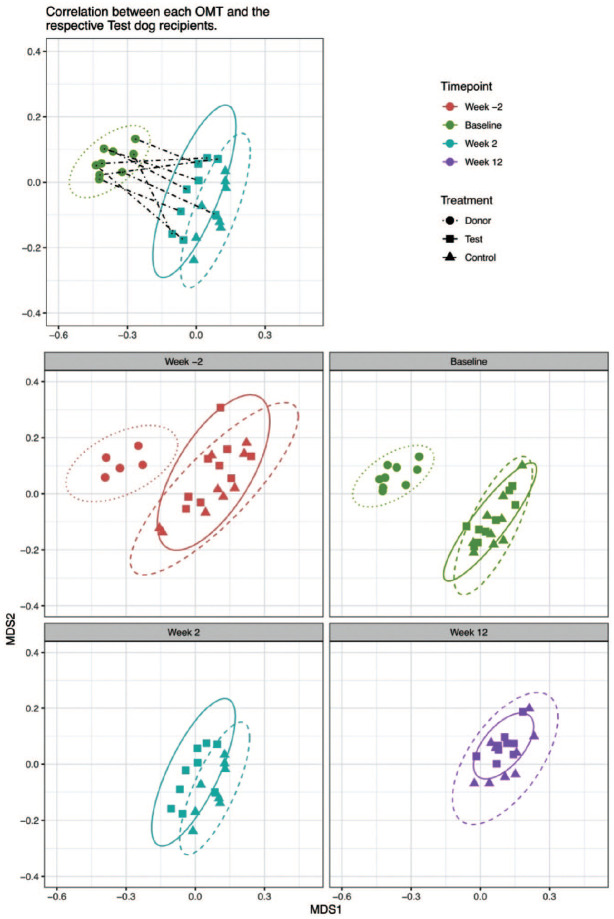
Figure 3.
Principal coordinates analysis (PCoA) ordinations showing the beta-diversity of the oral microbiota in test, control, and donor groups, based on Bray-Curtis dissimilarity values. Various sets of subject data-points are shown in the 5 respective PCoA plots included in the figure panels for the sake of clarity. All PCoA plots are drawn to the same scale, with the same axes. Top left panel: PCoA plot showing oral microbiota transplant (OMT) samples collected from periodontally healthy donor dog (filled circles) immediately prior to transplantation and the oral microbiota of test dogs (filled squares) and control dogs (filled triangles) at the week 2 time point. Dashed lines link the 9 OMT samples with the 9 respective test dog recipients. Top right panel: figure key. Middle left panel: donor, test, and control dogs’ oral microbiota at the week –2 time point. Middle right panel: OMT samples collected from donor immediately prior to transplantation and oral microbiota of test and control dogs at baseline time point. Bottom left panel: oral microbiota of test and control dogs at the week 2 time point. Bottom right panel: oral microbiota of test and control dogs at the week 12 time point. Week –2 time point (red), baseline time point (green), week 2 time point (blue), and week 12 time point (purple). Ellipses were plotted at a confidence level of 0.95. The oral microbiota of the test dogs was more closely related to the respective OMT samples at the week 2 time point. Analogous PCoA plots that include different combinations of data-points are included in the appendix material.

