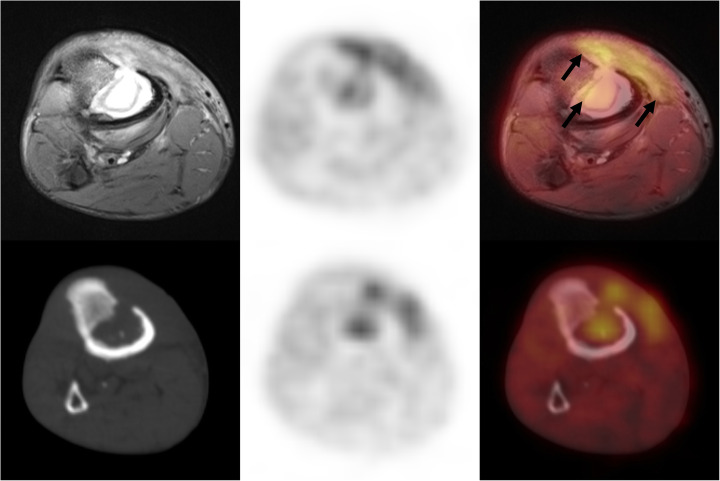
Fig. 1.
Reconstructed axial images of the affected region (left tibia) from patient 1. Top row, left to right: T2-weighted MRI, PET component of PET/MRI, and hybrid PET/MRI overlay. Bottom, from left to right: CT, PET component of PET/CT, and hybrid PET/CT overlay. Black arrows denote on hybrid PET/MRI, and the area of high FDG uptake can clearly be demarcated by soft tissue features that are depicted by MRI

