
Fig. 1.
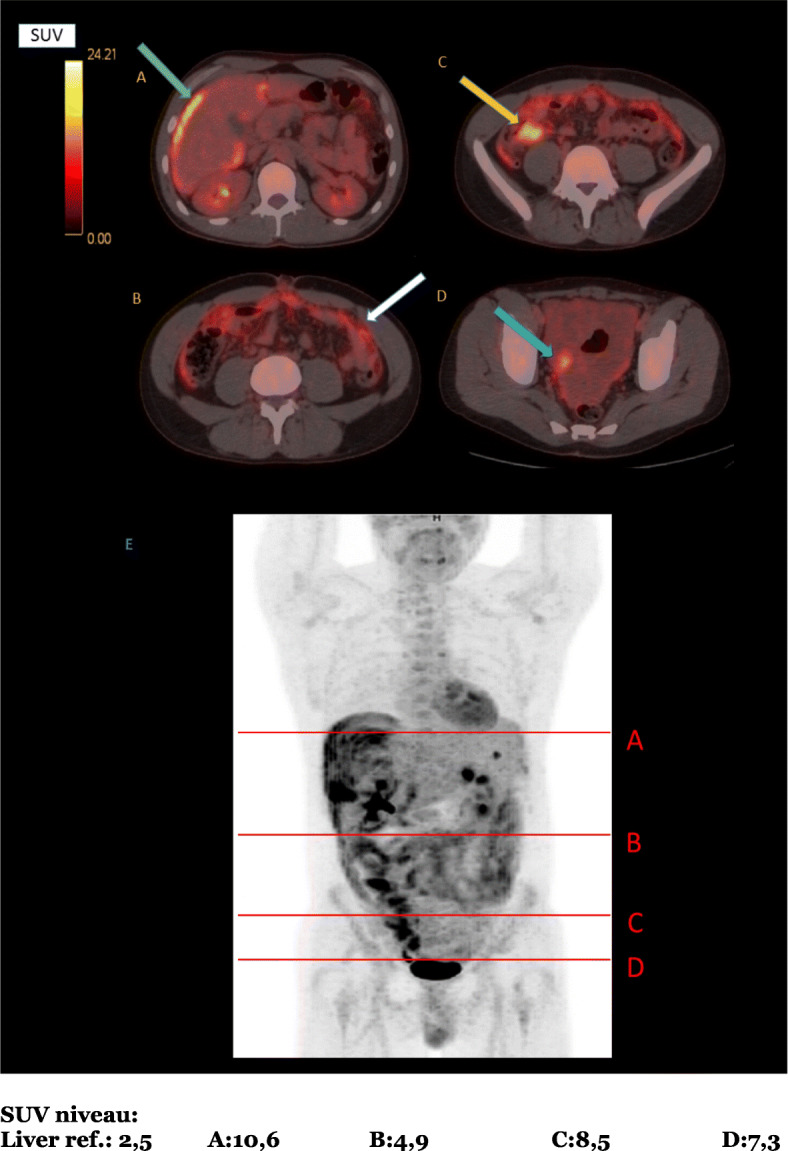
FDG-PET/CT scans showing foci with pathologic FDG-uptake. (a) Surface of the liver (green arrow). (b) Omental uptake (white arrow). (c) Colonic uptake (yellow arrow). (d) Pelvic ascites (blue arrow). (e) Levels of the images shown in (a)–(d) (FDG standardized uptake value scale shown)