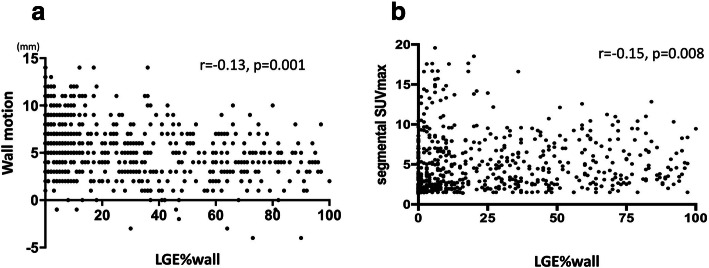
Fig. 5.
Segmental analysis of wall characteristics (LGE%wall vs. a segmental SUVmax, b wall motion) were shown in graphs. Significant inverse correlation was found between LGE%wall vs. segmental SUVmax and wall motion. LGE%wall and wall thickness did not show statistical significance. In the plots with a-dyskinetic wall motion, SUVmax was below 10. Wall thickness had significant correlation to segmental SUVmax, and thickened wall showed significant higher SUVmax

