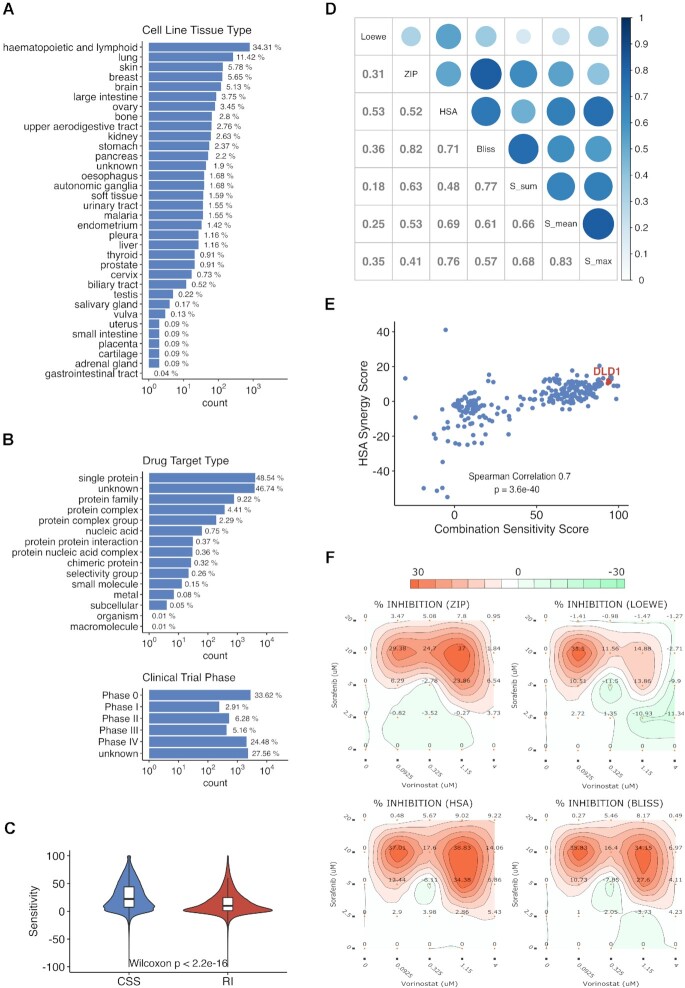
Figure 2.
Overview of DrugComb data statistics. (A, B) Classifications of cell lines (n = 2320) and drugs (n = 8397). (C) The CSS score for drug combinations is higher than the RI score for monotherapy drugs, suggesting the general rationale for drug combination studies. (D) The correlations of synergy scores. (E) An example of SS plot for vorinostat and sorafenib combination across 128 cell lines. DLD-1 is a colon cancer cell line, which has shown strong synergy and sensitivity to the combination (38). (F) The synergy landscape over the dose-response matrix of vorinostat and sorafenib in DLD-1.

