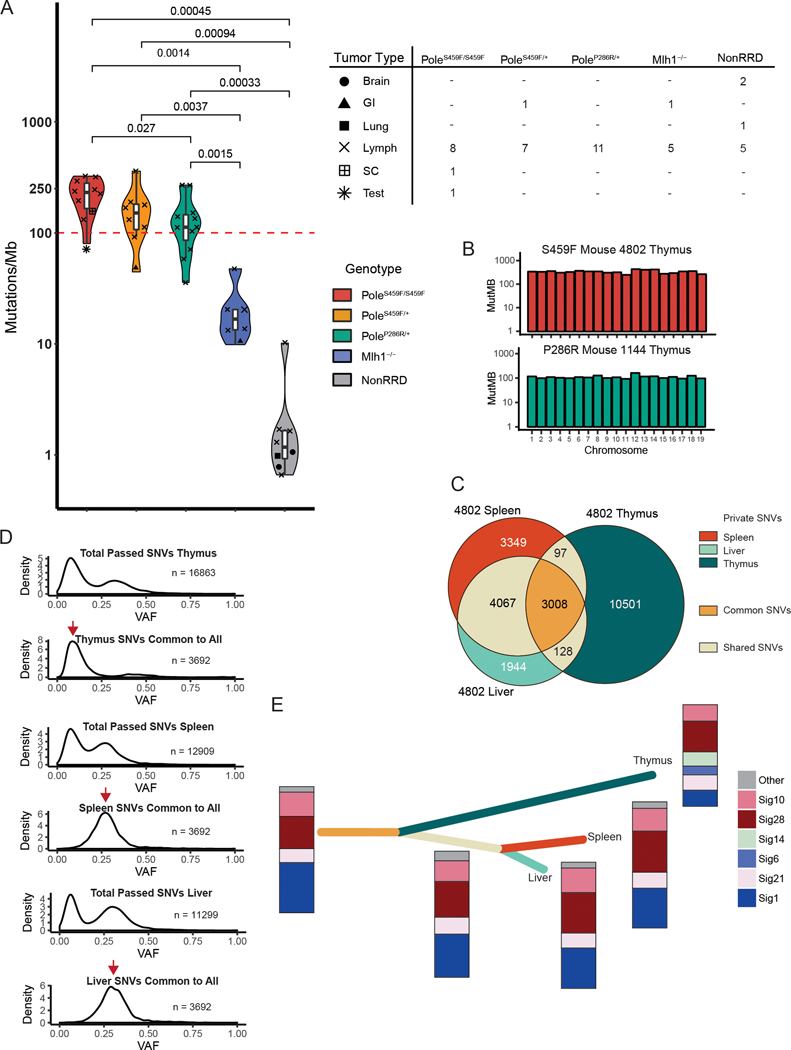
Figure 2. The genomic landscape of Pole mutant mouse tumors resembles that of POLE-driven human cancers and gives insight into mutagenesis mechanisms.
(A) Left -Violin plot showing mutation frequency from tumor whole exome sequencing (WES) of mouse tumors. Pole mutant mouse cancers (PoleS459F/S459F n = 10; PoleS459F/+ n = 8; PoleP286R/+, n = 11) were compared to MMRD mouse tumors (n=6) and replication repair proficient mouse-derived tumors (n =8). The red dashed line indicates 100 mutations/Mb. Significance are indicated using Student’s T-test. Scatter plot symbols indicate tumor type for each group and are summarized in: Right – table summarizing tumor types sequenced for each genotypic group. Brain = brain tumor; GI = gastrointestinal adenocarcinoma; Lung = lung adenocarcinoma; Lymph = lymphoma; SC = sarcoma; Test = testicular germ cell tumor.
(B) Mutation frequencies, as calculated by the number of mutations per target region covered, are plotted per chromosome, and reveal no evidence of localized hypermutation.
(C) Exome data from tumor fractions from a single mouse were compared. Private SNVs were defined as SNVs that were present only in one specific fraction. Shared SNVs were present in two fractions. Common SNVs were present in all fractions. The number of private, shared, and common SNVs are all indicated. Corresponding tumor fractions are indicated.
(D) Density plots of the number of single nucleotide variants (SNVs) by variant allele fraction (VAF) in each of the tumor fractions. SNVs unique to indicated tumor fractions and common to all tumor fractions were subsetted and plotted for each fraction. Red arrows indicate the presence of common SNVs in early and late clones for thymus vs. spleen and liver respectively.
(E) Constructed evolutionary tree for tumor 4802 based on three sequenced fractions. Length of branch is proportional to the number of SNVs. Colours correspond to private, shared, and common SNVs indicated in (C). Stacked bars indicate the proportion and presence of mutational signatures.

