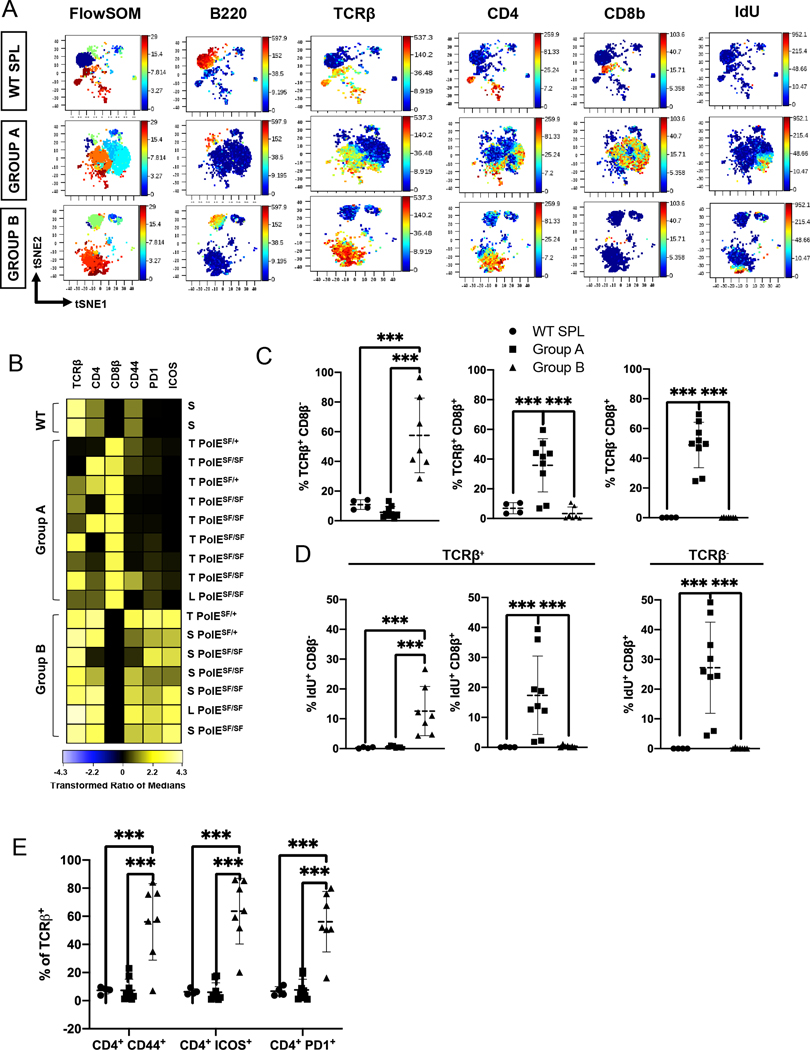
Figure 3. Identification of two distinct types of T cell lymphoma in Pole mutant mice.
(A) Representative t-SNE plots of FlowSOM clusters present in wild-type (WT) SPL (top) compared to representative Group A (middle; 3031) and Group B (bottom; 3158) lymphomas. Maps were colored in the Z dimension by FlowSOM cluster number (left) or the indicated lineage markers.
(B) Heatmap of marker expression (columns) by CD11b− B220− cells in each sample (rows). Marker intensity was normalized to the transformed ratio of medians by the column’s minimum. Samples were manually grouped as control WT SPL (n=2), Group A lymphomas with high CD8β and variable TCRβ and CD4 expression (n=9), and Group B lymphomas with high TCRβ and CD4 and little CD8β expression (n=7) subsets. Sample ID to the right indicates Pole genotype (S459F/S459F = SF/SF; S459F/+ = SF/+) and tissue: thymus (T), spleen (S) and lymph node (L).
(C) Scatter plots show the % of each subset (y axis), identified by manual gating, of the indicated subsets among live single cells: TCRβ+ CD8β− (left), TCRβ+ CD8β+ (middle) and TCRβ− CD8β+ (right) in WT SPL (n=5, circles) versus Group A (n=9, squares) and Group B (n=7, triangles) lymphomas. Means are identified with a dashed horizontal line on each bar and whiskers show the SD. These graphs include all the lymphoma samples shown on the heatmap in part B.
(D) Scatter plots show the percentage of IdU+ CD8β+ and IdU+ CD8β− cells within the TCRβ+ subset (left and middle) compared to the % IdU+ CD8β+ cells in the TCRβ− B220− CD11b− subset (right) defined as shown in Supplementary Fig. 6A. Data are shown for the same samples shown in part C.
(E) Scatter plots configured as described in (C) show the relative abundance of CD4+ cells expressing CD44, PD1 or ICOS cells among TCRβ+ cells from the groups shown in part C. Differences between groups were evaluated by ordinary one-way ANOVA, using a false discovery framework (FDR) of 5% to yield q values. Significant differences are noted by: ***, q<0.001; **, q<0.002, *, q<0.033.

