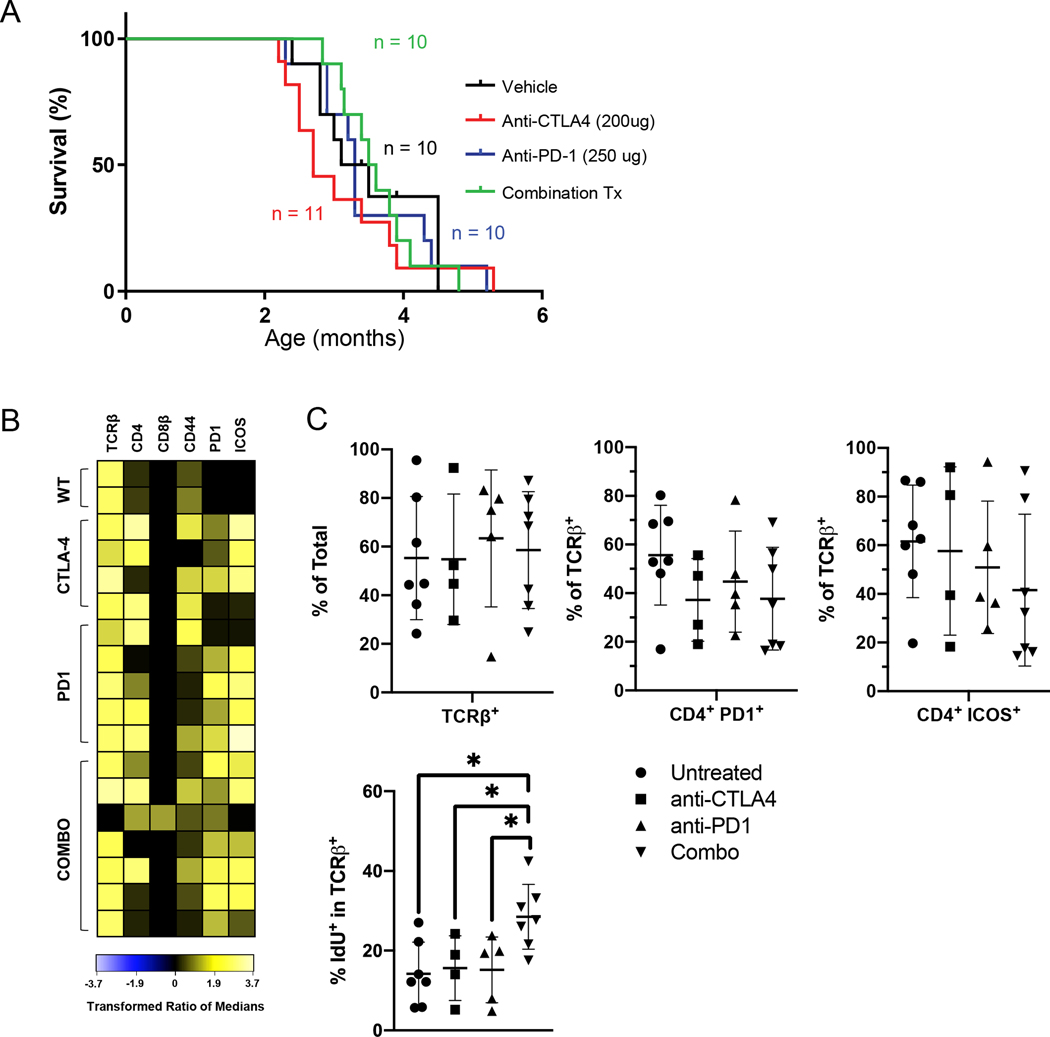
Figure 4. Impact of prophylactic immune checkpoint blockade on Pole driven lymphomagenesis.
(A) Kaplan-Meier survival estimates from control, anti-PD1, anti-CTLA-4, and combination treated PoleS459F/S459F mice. Treatments were delivered intraperitoneally (IP) twice weekly beginning at 6 weeks of age until mice were endpoint. Tumor-free, and overall survival findings are identical. One month = 4.3 weeks. (p = 0.82; Log-rank test).
(B) Heatmap of marker expression (columns) by CD11b− B220− cells in each sample (rows) from from WT SPL or each treatment group at end-point configured as described for Figure 3B. Data for the untreated mice (n=7) was replotted from Figure 3.
(C) Top: Scatter plots (configured as described in Fig. 3) show the percentage of TCRβ+ cells among total live cells (left) and the %CD4+ PD1+ (middle) or %CD4+ ICOS+ cells among TCRβ+ cells in each treatment groups. There was a single Group A tumor in the Combo treatment group in which most proliferating cells were TCRβ− CDβ+ PD1− (not shown), but we chose not to exclude this sample to keep the analysis unbiased. Bottom: Scatter plots show relative the %IdU+ cells in the TCRβ+ subset from each treatment group. Anti-CTLA-4 (n=4), anti-PD1 (n-5), Combo (n=7). Significant differences in abundances were tested and displayed as in Fig. 3 except that each treatment group was compared only to the untreated group.

