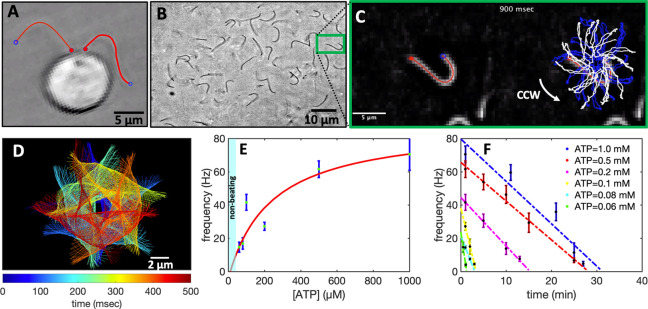
Figure 3.
Experiments with pure commercial ATP. (A) Snapshot of a C. reinhardtii cell with its two flagella. (B) Isolated and demembranated flagella are reactivated with pure ATP. (C) Swimming trajectory of an exemplary axoneme beating at 18 Hz with [ATP] = 80 μM (see Videos S1–S2). (D) Color-coded time projection of the axoneme in panel C shows the circular swimming path. (E) Mean beat frequency as a function of ATP concentration. Solid red line is a least-square fit to the modified Michaelis–Menten relation (see text). The critical minimum ATP concentration required to observe axonemal beating was [ATP]critical = 60 μM. (F) Beat frequency decays over time at a rate that depends on ATP concentration. In the presence of 1 mM ATP (blue line) in a 10 μL channel, axonemes beat for 32 min at a decreasing beating frequency that allows us to estimate the averaged ATP consumption rate of 0.31 nmol/min. This rate depends on ATP concentration and decreases to 0.25 nmol/min for [ATP] = 0.1 mM (yellow line). Error bars are mean ± standard deviation (N = 7).

