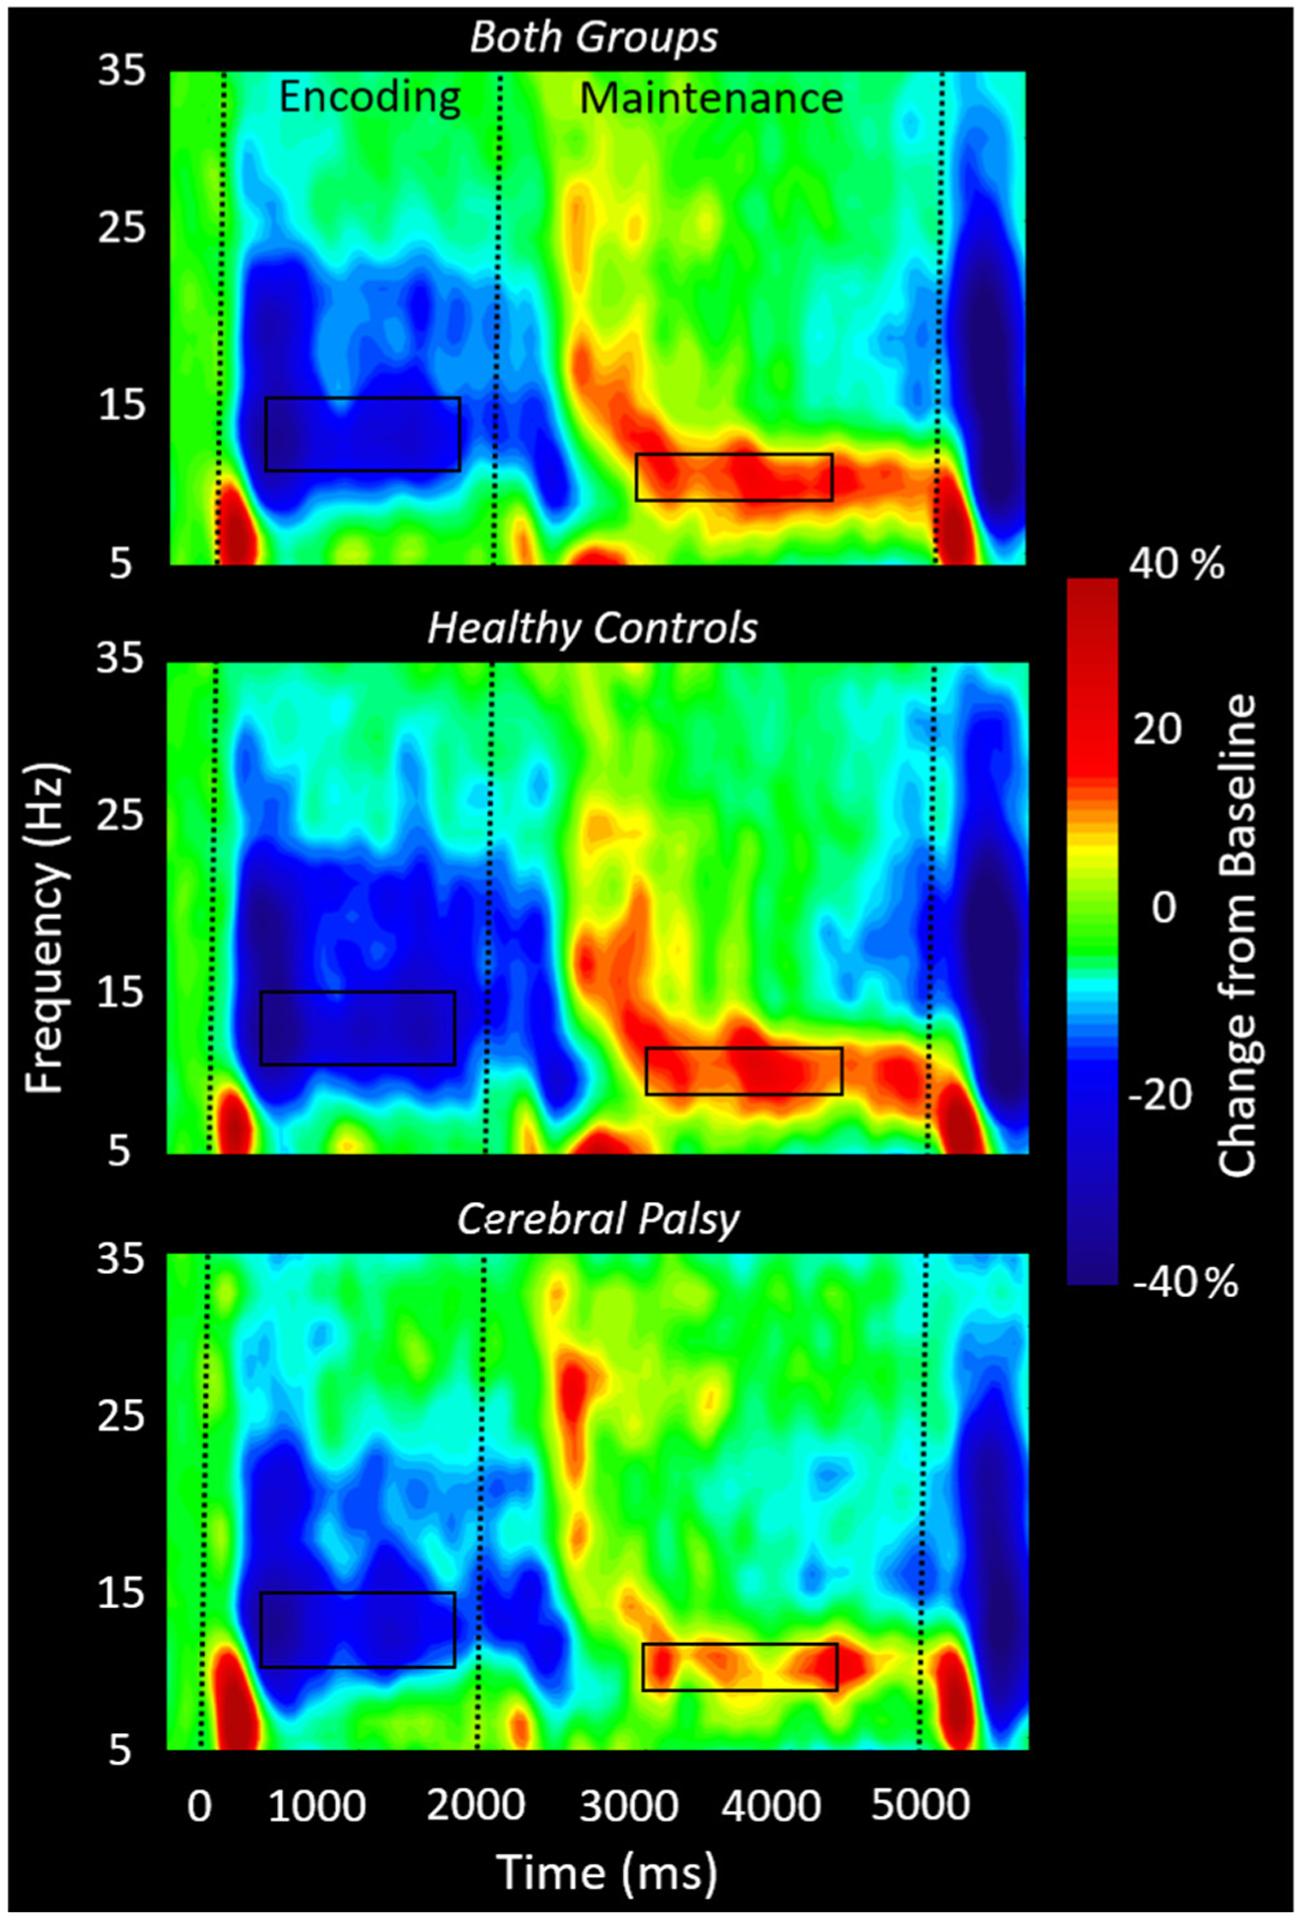
Fig. 2.

Group-averaged spectrograms from the same gradiometer sensor (located near the right parietal-occipital junction) are shown collapsed across groups (top) for the controls (middle) and adults with cerebral palsy (CP) (bottom). The time–frequency spectrogram displays time (ms) on the x-axis and frequency (Hz) on the y-axis. Percent power change was computed using the mean power in the baseline period (−400 to 0 ms) per bin. As shown in the respective figures, a significant decrease in alpha–beta (11–16 Hz) power can be discerned throughout the encoding and into early maintenance, followed by a significant alpha (9–13 Hz) increase throughout mid to late maintenance. Visual inspection of the spectrograms suggests that adults with CP had weaker oscillatory activity in the alpha–beta and alpha range compared to controls in the encoding and maintenance time windows, respectively. Time-frequency windows for source imaging (beamforming) were derived from statistical analysis of the sensor-level spectrogram data across all participants and these windows are outlined by the black boxes.
