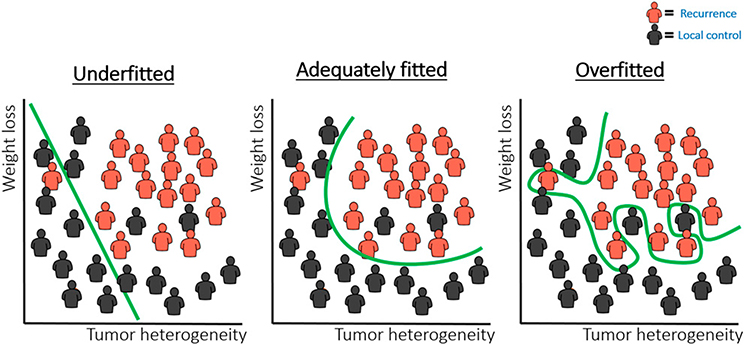
FIGURE 4. Example Case for a Classification Task.
To distinguish the patients in red (e.g., recurrences) from those in black (e.g., local tumor control), a model is optimized to define a borderline that increases the distance between the two groups. Examples of model fits that are underfitted (left), adequately fitted (middle), and overfitted (right) are depicted.

