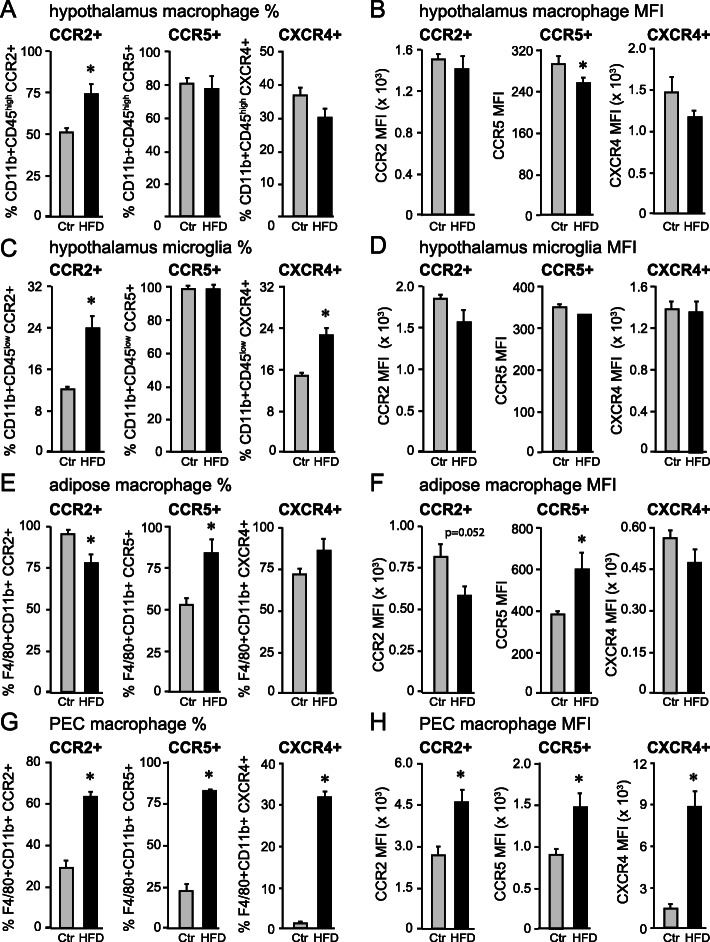
Fig. 5.
Chemokine receptor levels. A, C, E, and G The proportion of macrophages (A, E, G)/microglia (C) that express CCR2, CCR5, or CXCR4 receptors. B, D, F, and H Mean fluorescent intensity (MFI) indicates the levels of expression of CCR2, CCR5, or CXCR4 in macrophages. A, B Hypothalamic macrophages CD11b+CD45high; C, D hypothalamic microglia CD11b+CD45low; E, F visceral fat macrophages F4/80+CD11b+; G, H Peritoneal cavity (PEC) macrophages F4/80+CD11b+. The proportion of CCR2-positive cells increases in the hypothalamic macrophages and microglia, while the proportion of CCR5+ macrophages increases in the adipose tissue. PEC macrophages increase proportions of CCR2-, CCR5-, and CXCR4-positive cells. Statistical significance (*) between Ctr (gray bars,) and HFD (black bars) were determined by Student’s T test followed by Tukey’s post hoc test

