Fig. 6.
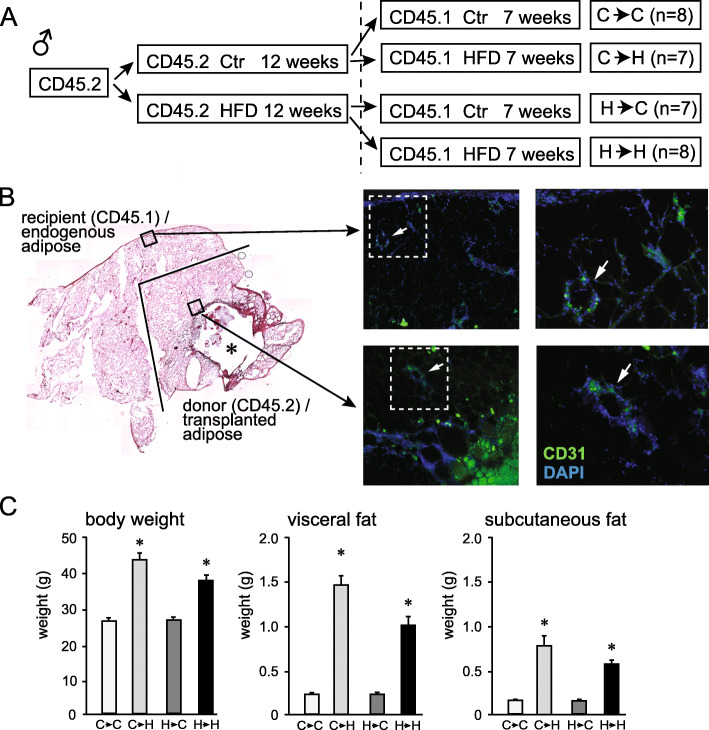
Fat transplant. A Experimental design: CD45.2 mice were fed control (Ctr) or high fat diet (HFD) for 12 weeks. Their visceral fat depots were transplanted into visceral depots of 8-week-old recipient CD45.1 mice that were then placed on either Ctr or HFD for additional 7 weeks. The column on the right indicates n in each group and the name of the group, where the first letter indicates the diet of the donor mouse and the second letter shows the diet of the recipient mouse. B Visceral fat depot that contains donor adipose tissue (donor) and recipient adipose tissue (endogenous). Left, H&E stain to observe histology. Right side, immunofluorescent staining using CD31 (green) and DAPI (blue) to detect endothelial cells and demonstrate vascularization of transplanted tissue in the bottom panels compared to the endogenous tissue in the top panels (enlarged areas indicated with squares). C Body weight, visceral fat depot weight, and subcutaneous fat depot weight. Statistically significant difference (*) between control-fed recipient (second letter C) and HFD-fed recipient (second letter H) were determined by ANOVA followed by Tukey’s pos thoc test

