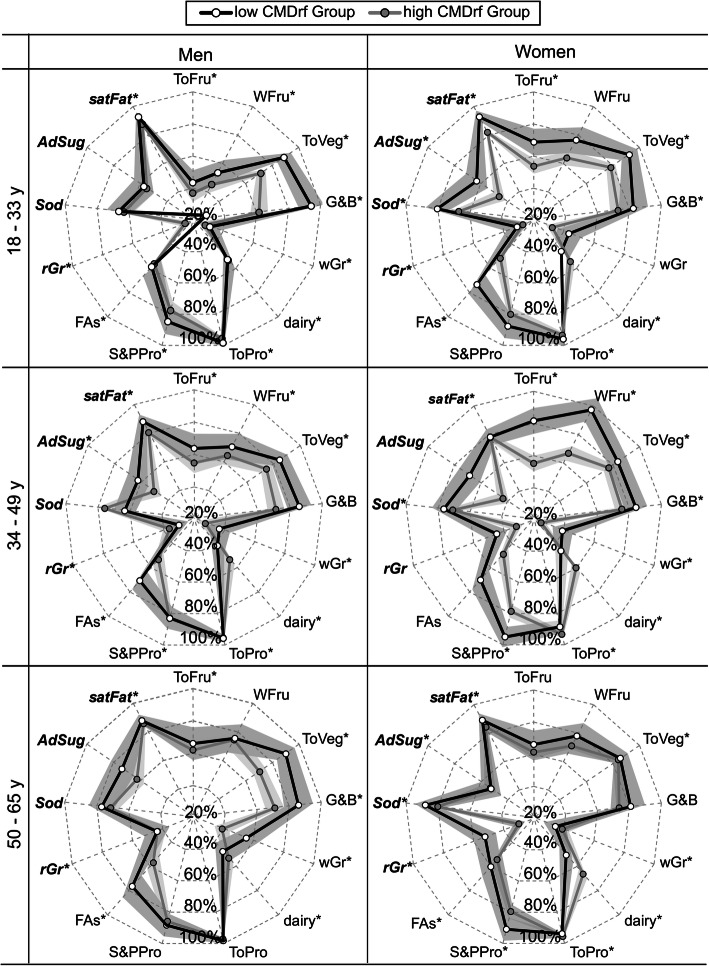
Fig. 2.
Diet patterns by sex and age for low and high cardiometabolic risk factors (CMDrf). Radar graph depicting dietary patterns of quality according to Healthy Eating Index-2015 (HEI) for a low (n = 106) and high (n = 272) CMDrf in women and men by age in a cross-sectional study. HEI-component scores are expressed as a percentage of their maximum score, with scores increasing with diet quality. Each point represents the mean ± standard error of means. Diet components in bold-italic are recommended to be eaten in moderation. * The symbol represents the HEI-components included in the predicted CMDrf models. Abbreviation of HEI-components are total-vegetables (ToVeg); saturated fat (satFat); total protein (ToPro); refined-grains (rGr); ‘fatty acids’ (FAs); ‘greens and beans’ (G&B); whole-grain (wGr) total-fruit (ToFru); sea-food and plants (S&PPro); whole-fruits (WFru); ‘added sugars’ (AdSug; n = 3); ‘sodium’ (Sod)

