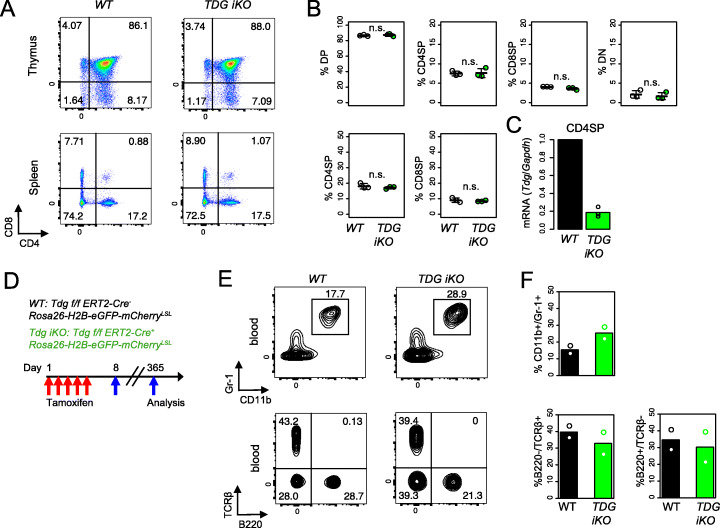
Fig. 6.
TDG-deficient mice show normal hematopoiesis. A Flow cytometry plots and B quantification of CD4 and CD8 in the thymus (upper) and spleen (lower) in WT (n = 3) and TDG-KO (n = 3) mice, in which CD4Cre-driven gene deletion was achieved. C CD4 single positive (SP) cells were isolated from the thymus. Tdg transcripts were quantified by qRT-PCR and normalized to Gapdh and then to the level of WT control. Data from three independent experiments with three technical replicates each. D Flowchart of experiments. E Flow cytometry plots and F quantification of CD11b, Gr-1, B220, and TCR β chain in cells in the peripheral blood of WT (n = 2) and TDG iKO (n = 2) mice. Statistical significance was calculated using an unpaired two-tailed t test

