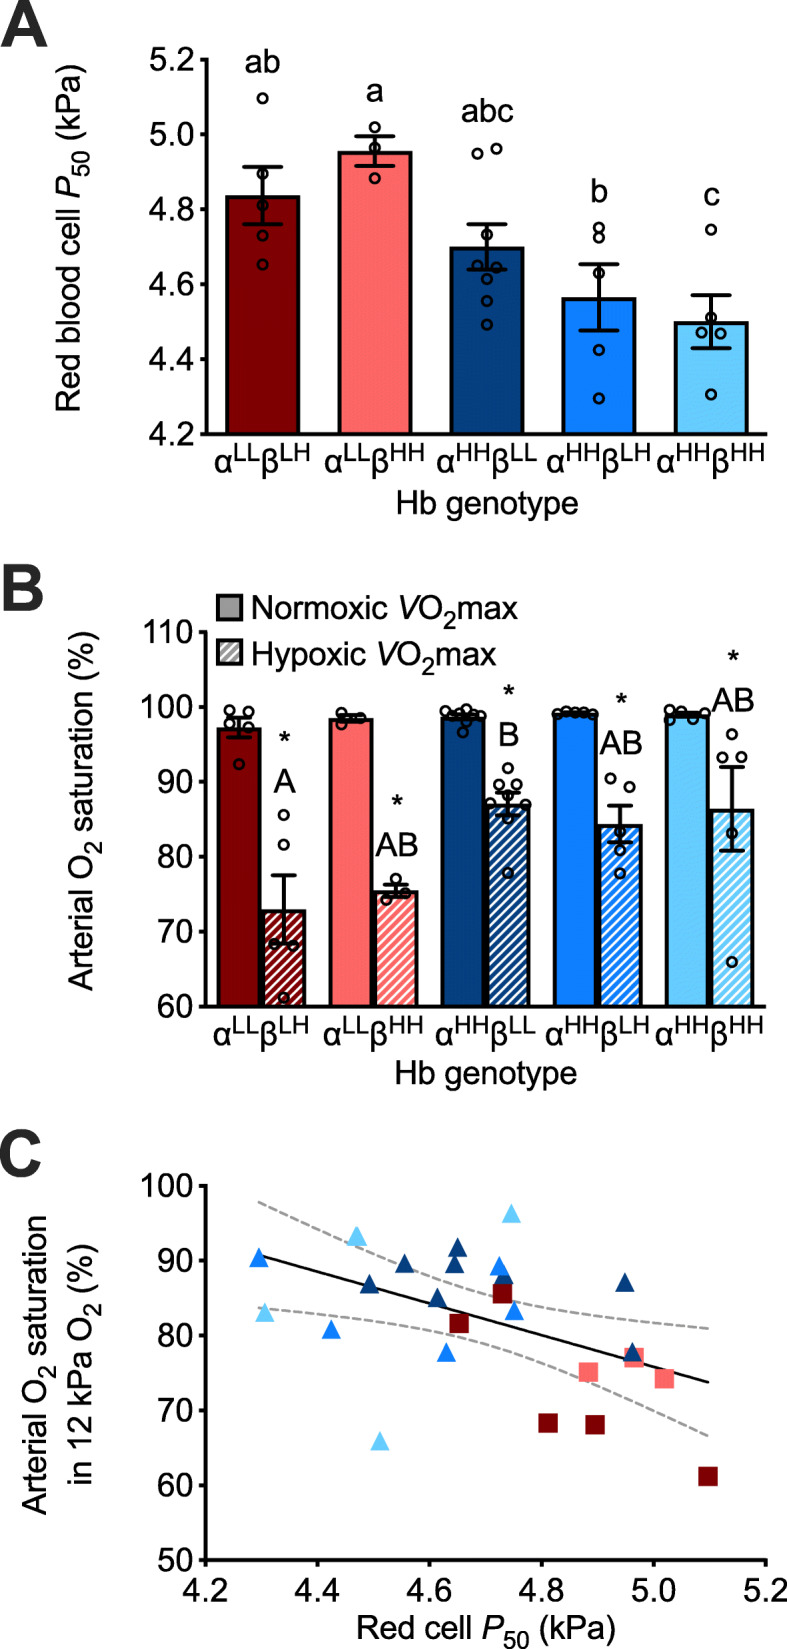
Fig. 2.

Variation in red blood cell O2 affinity and arterial O2 saturation associated with hemoglobin (Hb) genotype in F2 inter-population hybrid deer mice acclimated to normoxia. a Red blood cell P50 (O2 pressure at 50% saturation). b Arterial O2 saturation at V̇O2max measured in normoxia (21 kPa O2) and hypoxia (12 kPa O2). Bars display mean ± SEM (n = 3-8) with individual data superimposed (circles). Different α- and β-globin genotypes are shown as superscripts with “L” representing the lowland haplotype and “H” representing the highland haplotype. *P < 0.05, hypoxia vs. normoxia within a genotype. P < 0.05 between genotypes for values not sharing a letter. c Linear regression of arterial O2 saturation in hypoxia and red blood cell P50 for individual data (P = 0.0103, R2 = 0.2441; dotted line represents 95% confidence interval). Symbol colors reflect Hb genotype, as shown in a and b
