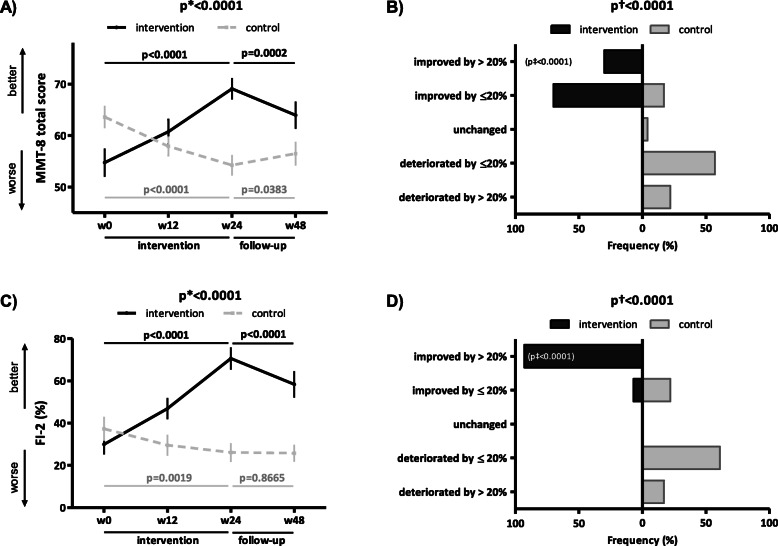
Fig. 2.
Primary outcomes objectively assessing muscle strength and endurance in the intervention and control group. In the intervention group (IG), the 24-week intervention led to a significant improvement in muscle strength objectively assessed by Manual Muscle Testing (MMT)-8 (A) and muscle endurance evaluated by Functional Index (FI)-2 (C), thus preventing the progressive deterioration observed in the control group (CG) over weeks 0–24. Although the improvement in MMT-8 (A) and FI-2 (C) in the IG was still present at week 48, the maximum effects were not sustained. In the IG, the improvement in MMT-8 (B) and FI-2 (D) was clinically meaningful (a 24-week improvement by >20%) in a substantial proportion of patients. Data in A and C are presented as the mean ± standard error of the mean (whiskers). Data in the tree diagrams (B and D) present the percentage distribution of patients by outcome, which is stratified into five levels of improvement/deterioration over weeks 0–24. w, week; p*, unadjusted inter-group comparison by two-way ANOVA; p, unadjusted intra-group comparison by one-way ANOVA in black (IG) and gray (CG); p†, difference in the overall distribution in five levels of the patient outcome by chi-square test; p‡, difference in the category of clinically meaningful improvement by chi-square test

