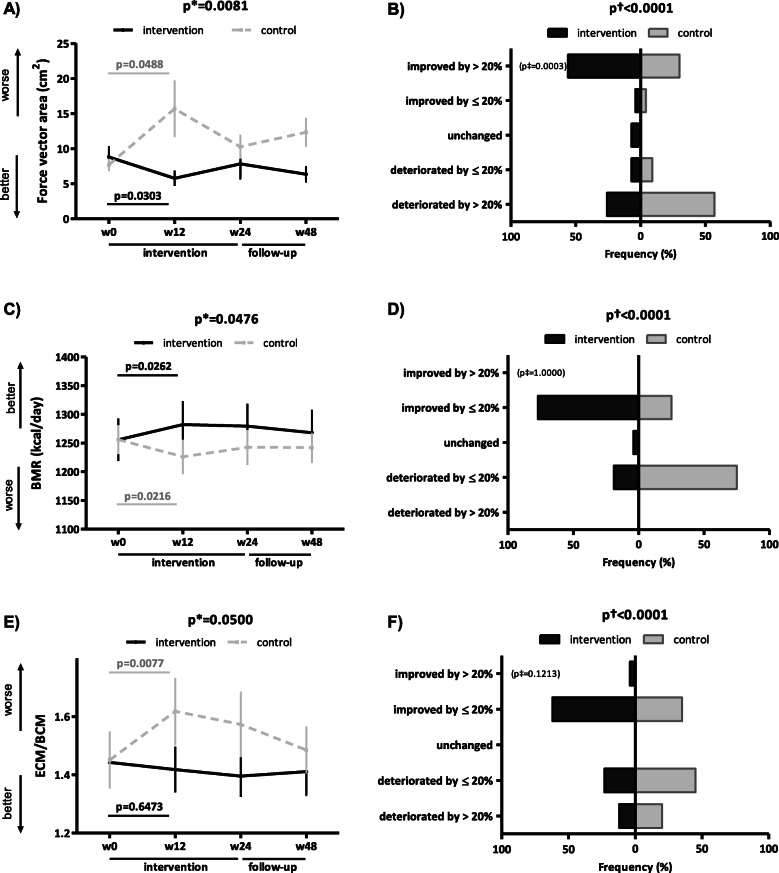
Fig. 4.
Secondary outcomes assessing stability, basal metabolism, and muscle fitness in the intervention and control group. In the intervention group (IG), the first 12 weeks of the intervention led to a significant improvement in objectively assessed stability (force vector area) (A), an increase in basal metabolic rate (BMR) (C), and stabilization of muscle fitness assessed by extracellular mass to body cell mass ratio (ECM/BCM) (E), thus preventing any significant deterioration observed in the control group (CG) over weeks 0–12. The improvement in stability (A) and BMR (C) and the stabilization of ECM/BCM (E) in the IG were still present at week 48. In the IG, the improvement in stability (B) was clinically meaningful (a 12-week improvement by >20%) in a substantial proportion of patients. The difference in the percentage distribution of patients according to five levels of improvement/deterioration over weeks 0–12 between the IG and CG was statistically significant for both BMR (D) and ECM/BCM (F). Data in A, C, and E are presented as the mean ± standard error of the mean (whiskers). Data in the tree diagrams (B, D, and F) present the percentage distribution of patients by outcome, which is stratified into five levels of improvement/deterioration over weeks 0–12. w, week; p*, unadjusted inter-group comparison by two-way ANOVA; p, unadjusted intra-group comparison by one-way ANOVA in black (IG) and gray (CG); p†, difference in the overall distribution in five levels of the patient outcome by chi-square test; p‡, difference in the category of clinically meaningful improvement by chi-square test

