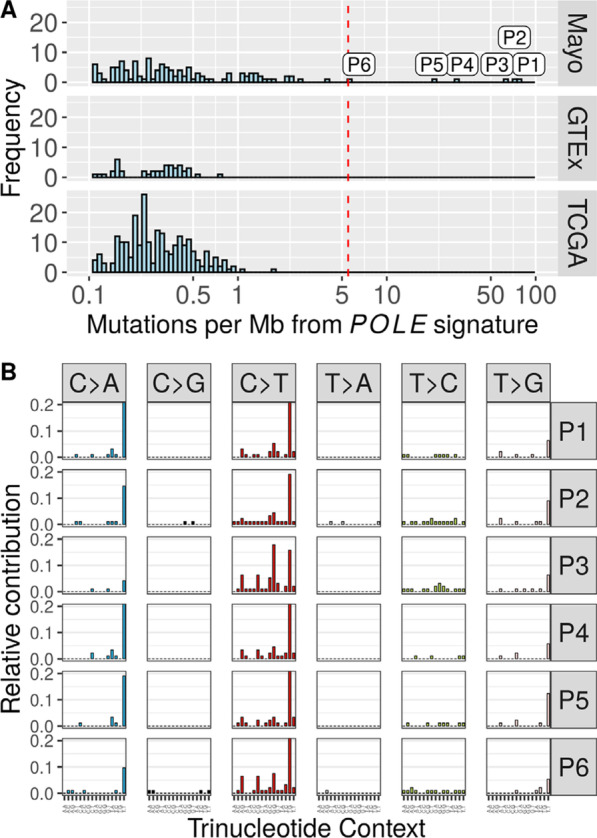
Fig. 2.

Identification of DNA Polymerase Epsilon (POLE)-Driven Ovarian Cancer Samples. a Distribution of the tumor mutation burden (TMB) attributed to the POLE signature across the cohorts from Mayo Clinic (Mayo), Genotype-Tissue Expression (GTEx), and The Cancer Genome Atlas (TCGA), which allows the identification of six samples (P1–P6) with high POLE contribution and more than five mutations per megabase. The red dashed line indicates a threshold used to separate between POLE positive and negative cases. b Mutational profiles of six POLE-driven Mayo Clinic OEC tumors according to the frequency of trinucleotide context for the six samples; their distinct C > A and C > T peaks are associated with the POLE signature. Red line denotes the threshold used for the outlier direction (5.7 Mut per Mb)
