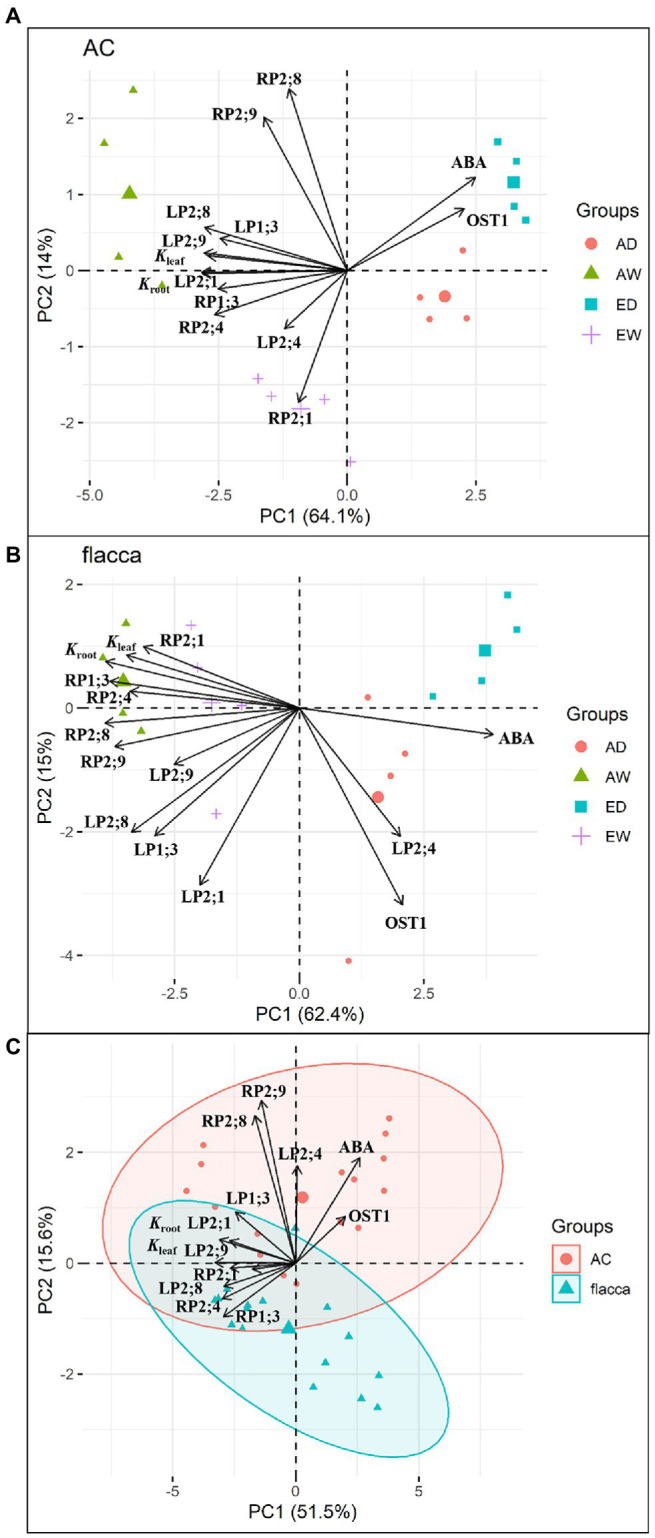
Figure 8.

Principal component analysis of tomato leaf and root hydraulic conductance (Kleaf and Kroot), xylem sap ABA concentration (ABA), gene expression of five leaf PIPs (LP), root PIPs (RP) and OST1 for (A) AC, (B) flacca, and (C) two genotypes grown under ambient (400 ppm) and elevated (800 ppm) atmospheric CO2 concentrations after progressive soil drying. AW: a[CO2] and well water; AD: a[CO2] and drought stress; EW, e[CO2] and well water; ED: e[CO2] and drought stress. The contribution of each PCA axis (PC1 and PC2) is indicated on the graph.
