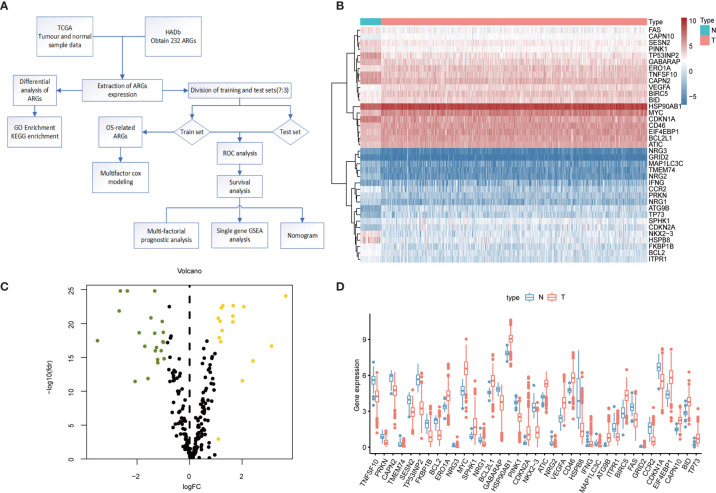
Figure 1.
Differential expression of ARGs between colorectal cancer and normal tissues. (A) Research Flowchart. (B) Clustered heat map of expression levels of 37 autophagy differential genes. Green is normal tissue; Orange is tumor tissue. Red indicates high expression, blue indicates low expression. (C) Volcano diagram of ARGs expression, with green indicating low expression and yellow indicating high expression. (D) Expression of 37 ARGs in colorectal cancer tumor tissues and paired non-tumor samples. Red represents tumor samples and blue represents non-tumor samples. ARGs, Autophagy-Related Genes; FDR, false discovery rate; FC, Fold Change; TCGA, The Cancer Genome Atlas.

