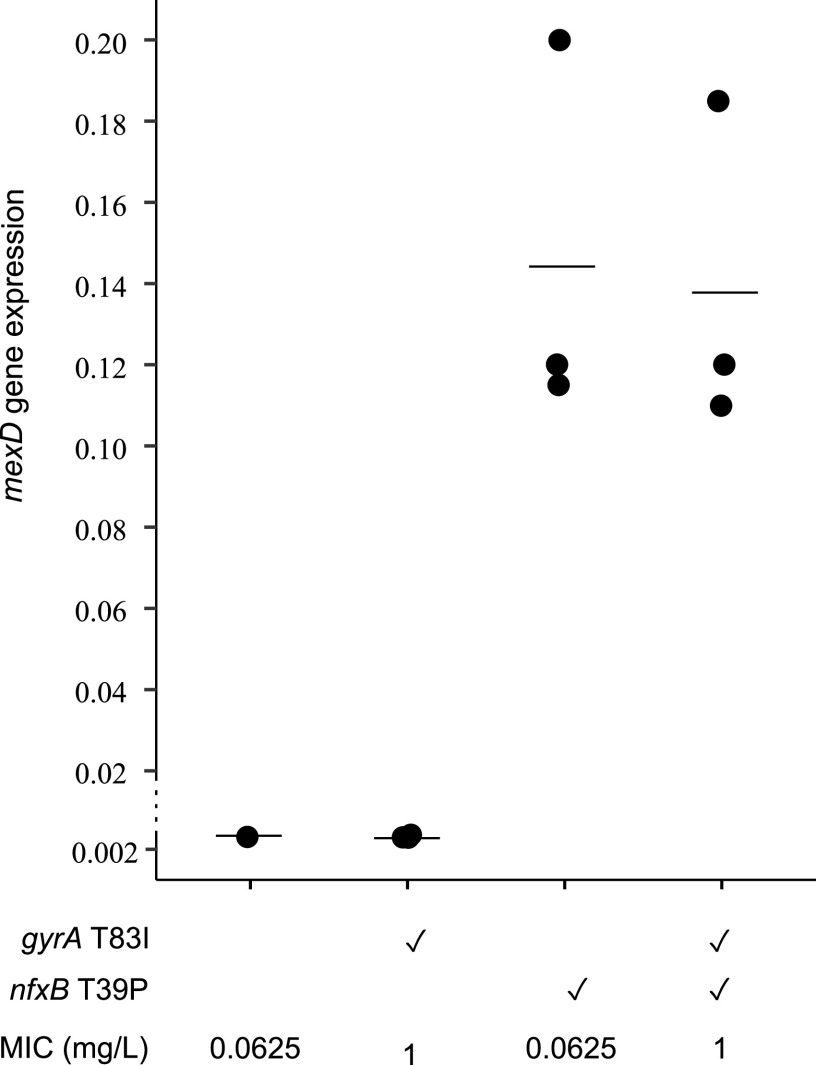
FIG 3.
Effects of mutation in nfxB on expression of mexD. Expression of mexD was quantified by RT-qPCR. Bars represent the average value of three biological replicates, which are shown as dots. Each dot is the average of 2 technical replicates. Individual values are listed in Table S2. The ✓ denotes the presence of mutations. P values were calculated from one-way ANOVA followed by Tukey’s test (post hoc t test) and showed significant (P < 0.01) difference in mexD expression between NfxB+ and nfxB mutant bacteria (Table S3).

