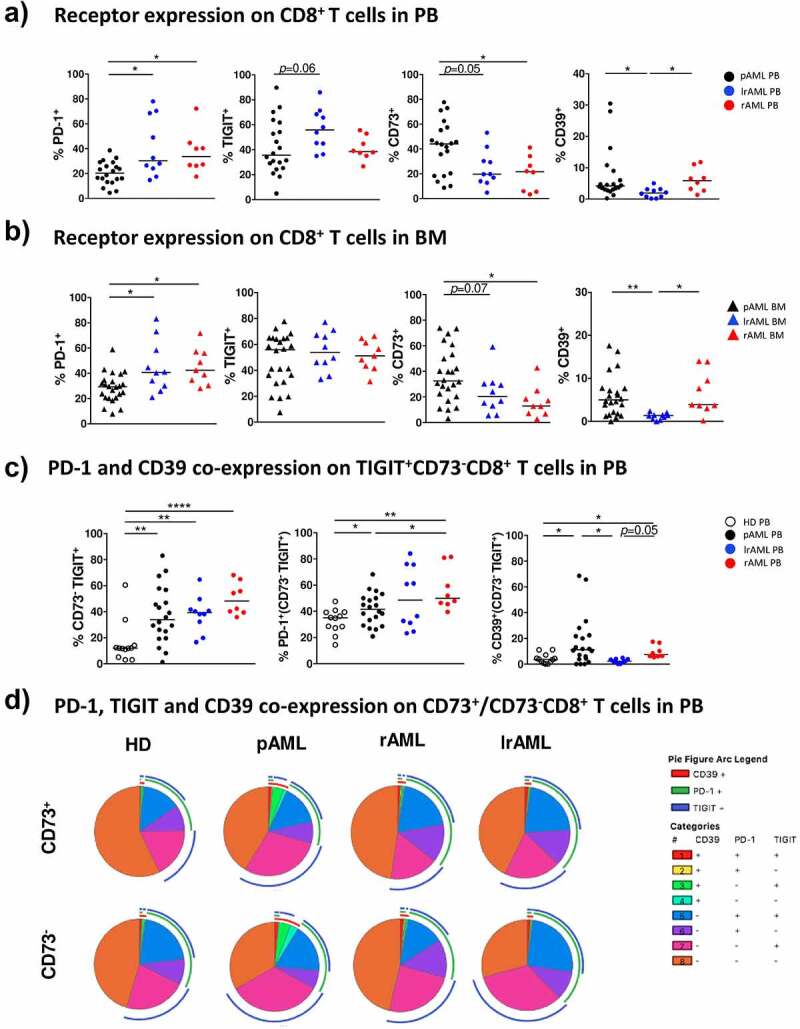
Figure 3.

Comparison of the expression of TIGIT, PD-1, CD73 and CD39 on CD8+ T cells in pAML, rAML and lrAML
The expression of PD-1, TIGIT, CD73 and CD39 was analyzed on CD8+ T cells in PB (A) and/or BM samples (B) from patients with pAML (PB, black circles, n = 20; BM, black triangles, n = 24), lrAML (PB, blue circles, n = 10; BM, blue triangles, n = 10), and rAML (PB, red circles, n = 8, BM, red triangles, n = 9), and of healthy donors (HDs) (PB, white circles, n = 12). (C) Summary data are shown comparing the frequency of TIGIT+CD73−CD8+ T cells and the expression of PD-1 and CD39 on this population in PB from HDs, pAML, IrAML, and rAML patients. (D) Pie Charts showing the distribution of subsets expressing combinations of TIGIT, PD-1, and CD39 on CD73+ or CD73− CD8+ T cells from HDs, pAML, IrAML and rAML patients. P values were obtained by ANOVA and Kruskal-Wallis test. *P < .05, **P < .01, ***P < .001.
