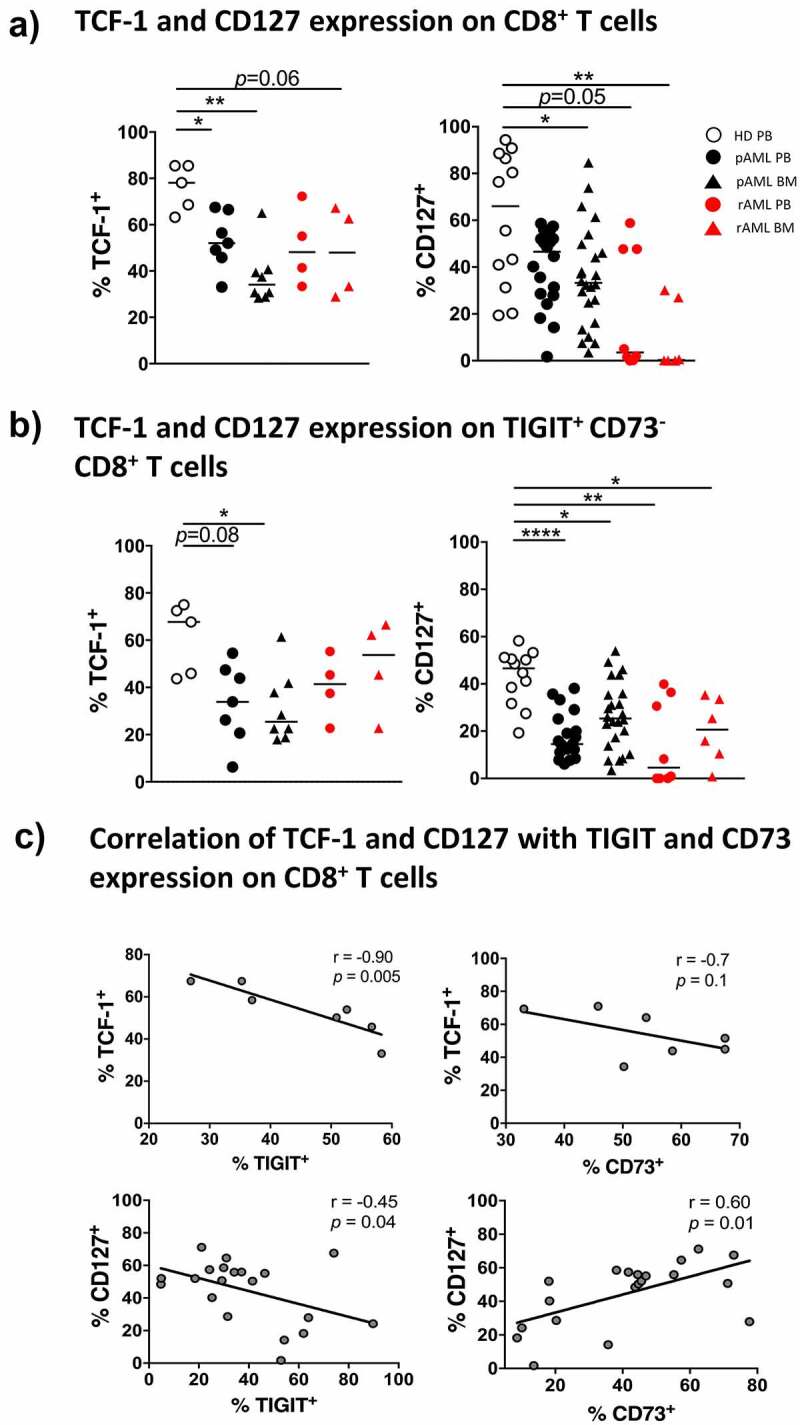
Figure 4.

Reduced frequencies of TCF-1+- and CD127+ CD8+ T cells in pAML and rAML vs. HDs
The expression of TCF-1 and CD127 was analyzed on total CD8+ T cells (A) and TIGIT+CD73− CD8+ T cells (B) from PB and/or BM of HDs (white circles, n = 5), patients with pAML (PB, black circles, n = 7 and BM, black triangles, n = 8), and patients with rAML (PB, red circles, n = 4 and BM, red triangles, n = 4). P values were obtained by ANOVA and Kruskal-Wallis test. *P < .05, **P < .01, ***P < .001. (C) Correlative analysis of the expression of TCF-1 and CD127 with TIGIT and CD73 in PB from patients with pAML. Pearson’s test was used to test for correlations.
