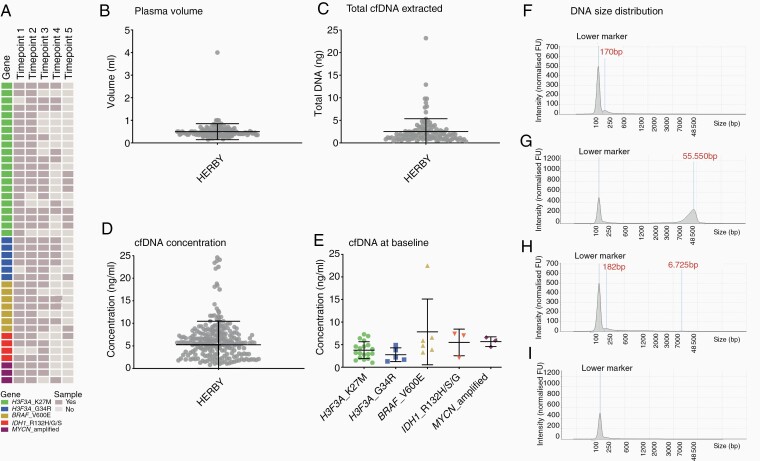
Figure 3.
Quantitation of plasma samples collected as part of the HERBY clinical trial. (A) A cohort of nonbrainstem pHGG plasma samples from the HERBY clinical trial, with each row representing a patient and each column a sample. Cells are colored by molecular alteration assessed and sample availability according to the key provided. Time-points are as follows: 1 = baseline, 2 = week 3, 3 = week 7, 4 = month 6, 5 = end of treatment. (B) Dot plot of volume of plasma used for cfDNA extraction. Each sample is represented by a dot, the middle line represents the median, and the upper and bottom line the standard deviation. (C) Dot plot of total cfDNA extracted from HERBY plasma samples. Each sample is represented by a dot, the middle line represents the median, and the upper and bottom line the standard deviation. (D) Dot plot of cfDNA concentration per mL from HERBY plasma samples. Each sample is represented by a dot, the middle line represents the median, and the upper and bottom line the standard deviation. (E) Dot plot of cfDNA concentration at baseline, separated by molecular subgroup. Each sample is represented by a dot, the middle line represents the median, and the upper and bottom line the standard deviation. (F) Electropherogram of cfDNA size distribution was obtained by using the TapeStation for a representative plasma sample with detectable levels of cfDNA (~170 bp). (G) Electropherogram of cfDNA size distribution was obtained by using the TapeStation for a representative plasma sample with a high degree of genomic DNA contamination (>55 kb). (H) Electropherogram of cfDNA size distribution obtained by using the TapeStation for a representative plasma sample with detectable cfDNA (182 bp) and genomic DNA (~6.7 kb) peaks. (I) Electropherogram of cfDNA size distribution obtained by using the TapeStation for a representative plasma sample with detectable DNA. The y-axis shows the signal intensity (FU) and the x-axis shows the DNA fragment size is represented in base pairs (bp).

