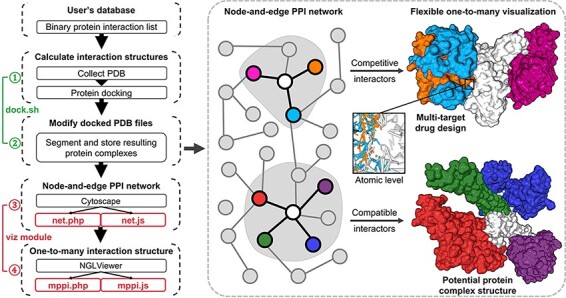
Figure 1.

Illustration of mPPI. The left part is the workflow of mPPI. After applying mPPI, the user’s database will acquire visualization functions demonstrated in the dashed box. In the dashed box, the left part is the 2D network representing binary protein–protein interaction from the user’s database. Any node in the network could be chosen to visualize its multiple interactors. The one-to-many structural presentation is highly flexible that the visibility, scale, angle and presentation style of each interactor can be adjusted for the most intuitive perspective. Two examples are demonstrated on the right side of the dashed box, where the colors correspond between the protein nodes and the 3D structures. Structurally compatible and competitive interactors are selected for visualization to assist protein macro-complex structure prediction and multi-target drug design. Atomic-level presentation is supported to further aid drug design and mechanism discovery, as shown in the middle of the dashed box.
