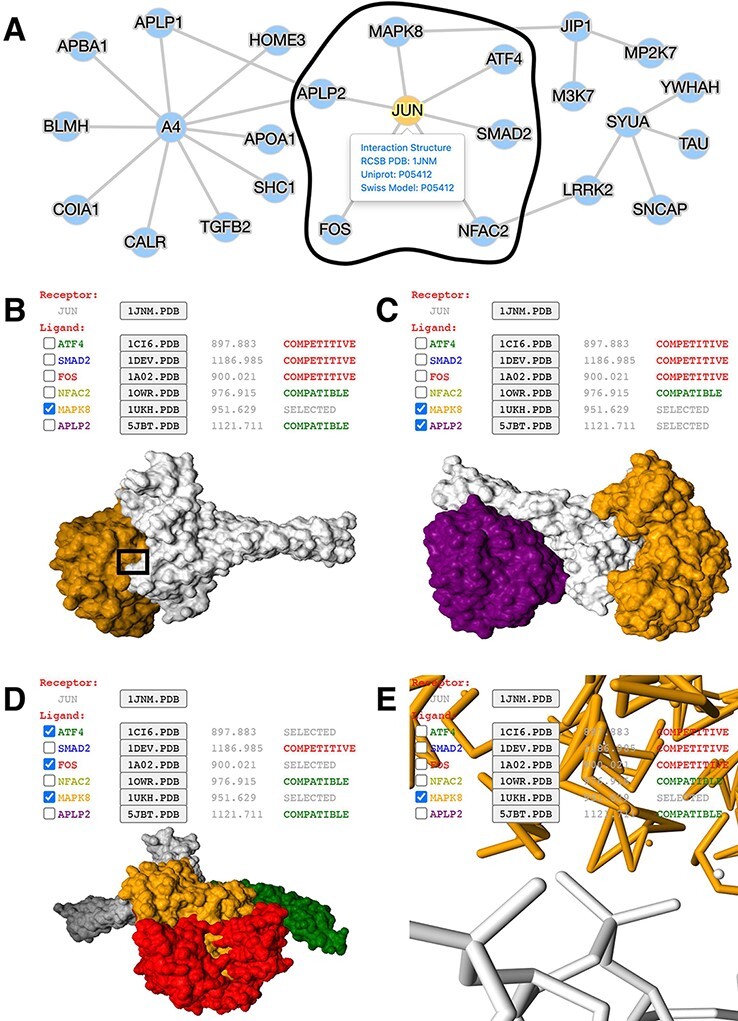
Figure 2.

Application of mPPI in a disease-related PPI database. (A) PPI network in node-and-edge representation. This example network is a sub-interactome containing 25 proteins related to ND (http://bis.zju.edu.cn/ndatlas/). The black circle stressed out a sub-network center at protein JUN that will be structurally displayed in Fig. 2B–E. (B) Presentation style and logistics of multiway structural interactions in mPPI. When selecting proteins to interact (in this example a protein MAPK8), the selected proteins will be tagged ‘SELECTED’, and all other proteins that are structurally compatible to them will be tagged ‘COMPATIBLE’, while other competitive ligands will be tagged ‘COMPETITIVE’, in the last column of each protein row. The checking and unchecking of each protein will change all the compatibility tags accordingly. (C) Illustration of one-to-many structural interaction. The center protein is JUN (white), and we select two compatible interactors MAPK8 (orange), APLP2 (purple) to visualize. (D) Another illustration of one-to-many structural interaction. The center protein is JUN (white), and interactors ATF4 (green), FOS (red) and MAPK8 (orange) are competitive. (E) PPI conformation at atomic resolution. The partial image of structural interaction stressed out in black box in Fig. 2B intuitively displays the binding interface of JUN and MAPK8. For each protein ligands, the docked structures can be downloaded for users’ further analysis by clicking the ‘.PDB’ button behind each protein name, and the docking scores (representing the tightness of the interaction calculated by ZDOCK) are shown behind each ‘.PDB’ button.
