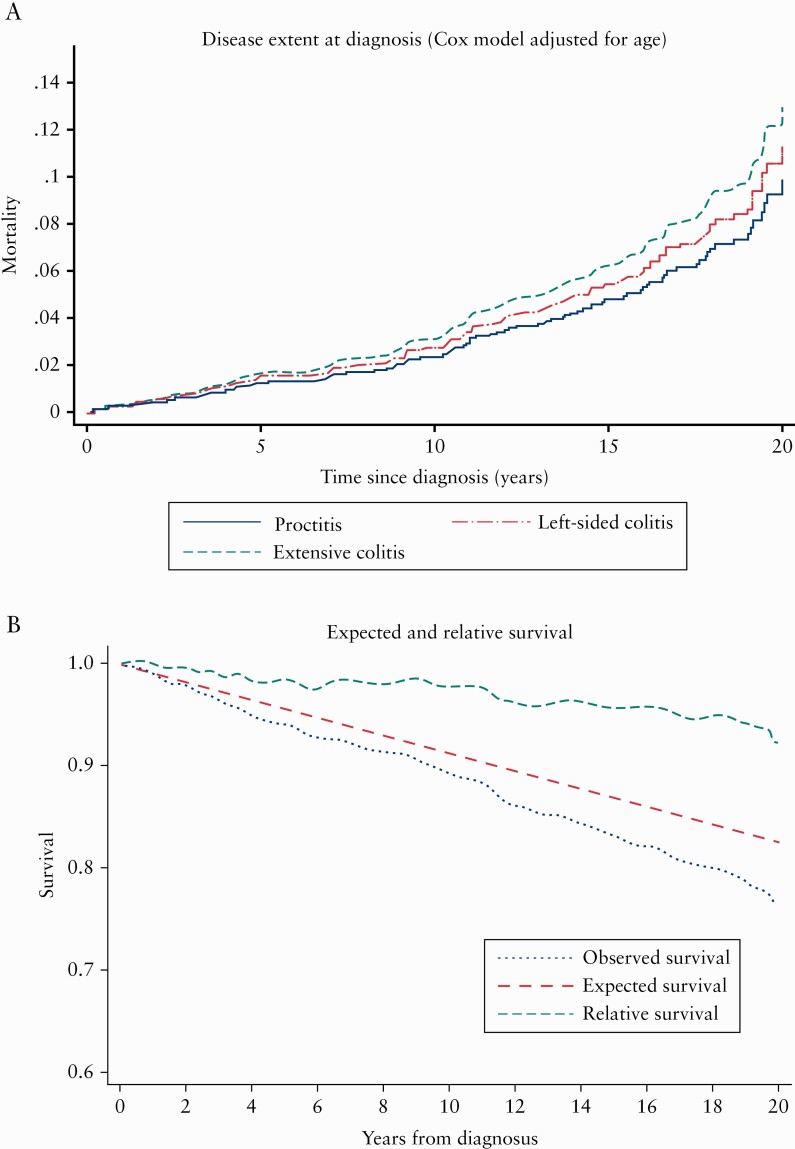
Figure 3.
a. Mortality [%] in UC according to disease extent during the 20-year FU period. b. Observed survival rate for the UC cohort [n = 519] during 20 years of follow-up compared with expected survival rate derived from life tables, and their ratio: the relative survival rate. UC, ulcerative colitis; FU, follow-up.

