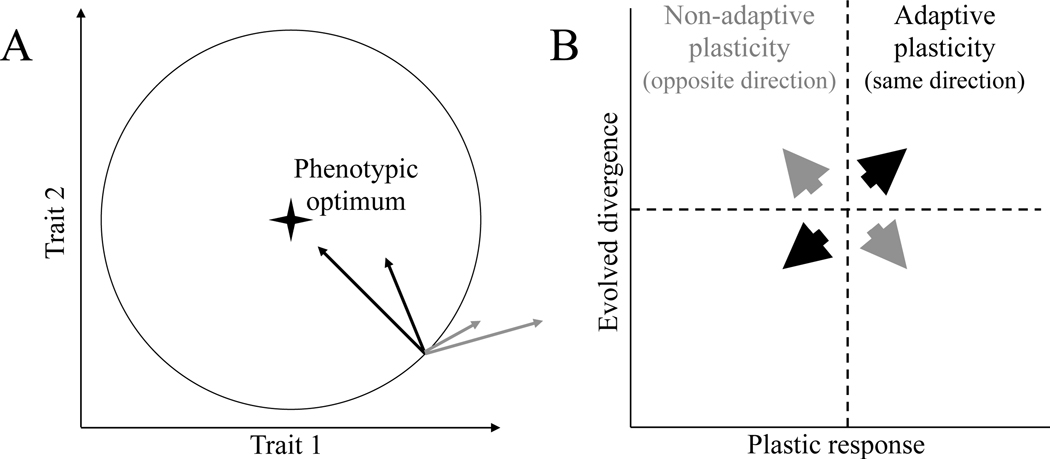
Figure 1. Examples of adaptive and non-adaptive plasticity.
Illustration of adaptive and non-adaptive phenotypic plasticity in general (A) and for gene expression (B). (A) Plastic responses that bring individuals closer to the local optimum (black) are examples of adaptive plasticity. Conversely, responses that bring individuals farther from the local optimum (grey) reflect non-adaptive plasticity (modified from Gibert et al. 2019). The diagram depicts two dimensions of phenotype space, and the optimal combination of phenotypic values for a particular environment is shown. (B) Plastic changes in gene expression (X axis) represent changes within an individual (or line) when measured in an ancestral environment and a novel environment, while evolved changes in gene expression (Y axis) represent differences between individuals (or lines) when measured in the same environment. In this case, the evolved changes are assumed to bring the derived population closer to its optimum. Under this assumption, plastic and evolved responses will be positively correlated when plasticity is adaptive, and negatively correlated plasticity is non-adaptive (Ghalambor et al. 2015). Modified from Fischer et al. (2016). See methods for further details.

