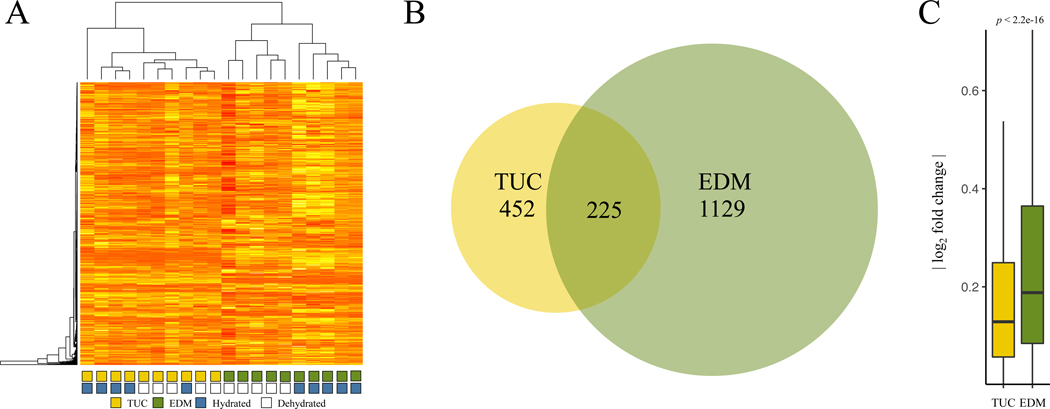
Figure 4. Evolved and plastic gene expression variation among hydrated and dehydrated mice from desert and non-desert environments.
(A) Heat map depicting relationships among samples for the top 1000 genes with greatest variance in expression. Expression patterns form two major groups, corresponding to line of origin (Tucson versus Edmonton). Edmonton samples also form clusters based on treatment (hydrated versus dehydrated) while Tucson samples do not. (B) Numbers of differentially expressed genes between dehydrated and hydrated samples in Tucson and Edmonton. Edmonton mice exhibit twice as many genes with differential expression between dehydrated and hydrated conditions compared to Tucson mice. The 225 genes at the intersection represent the shared transcriptional response to water stress. (C) Magnitude of fold changes in each population between dehydrated and hydrated samples. Vertical lines denote 1.5x the interquartile range.

