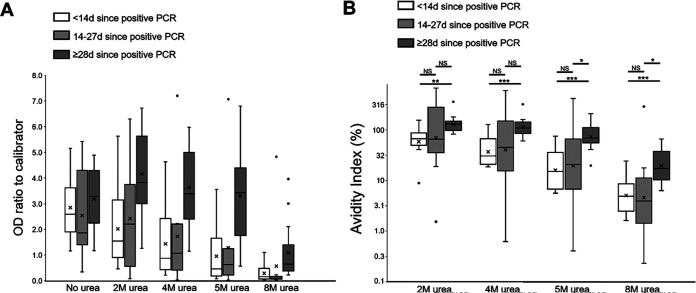
FIG 3.
Test results with or without urea-based avidity assays at 2 M, 4 M, 5 M, and 8 M with the Euroimmun NCP assay for 32 samples from persons with previous SARS-CoV-2-positive PCR. Each plot has three categories indicating persons testing SARS-CoV-2 PCR positive less than 14 days prior to sample collection, between 14 and 27 days prior, and 28 days or greater. (A) Boxplots display OD/calibrator ratios for all samples at each wash. (B) Avidity index for all samples at each molarity of urea wash, with statistically significant differences indicated. NS, not significant; *, P < 0.05; **, P < 0.01; ***, P < 0.001. For panels A and B, boxes show interquartile ranges (IQR), lines display medians, X symbol show means, and whiskers extend 1.5× above and below IQR. Markers display values outside 1.5× IQR.

