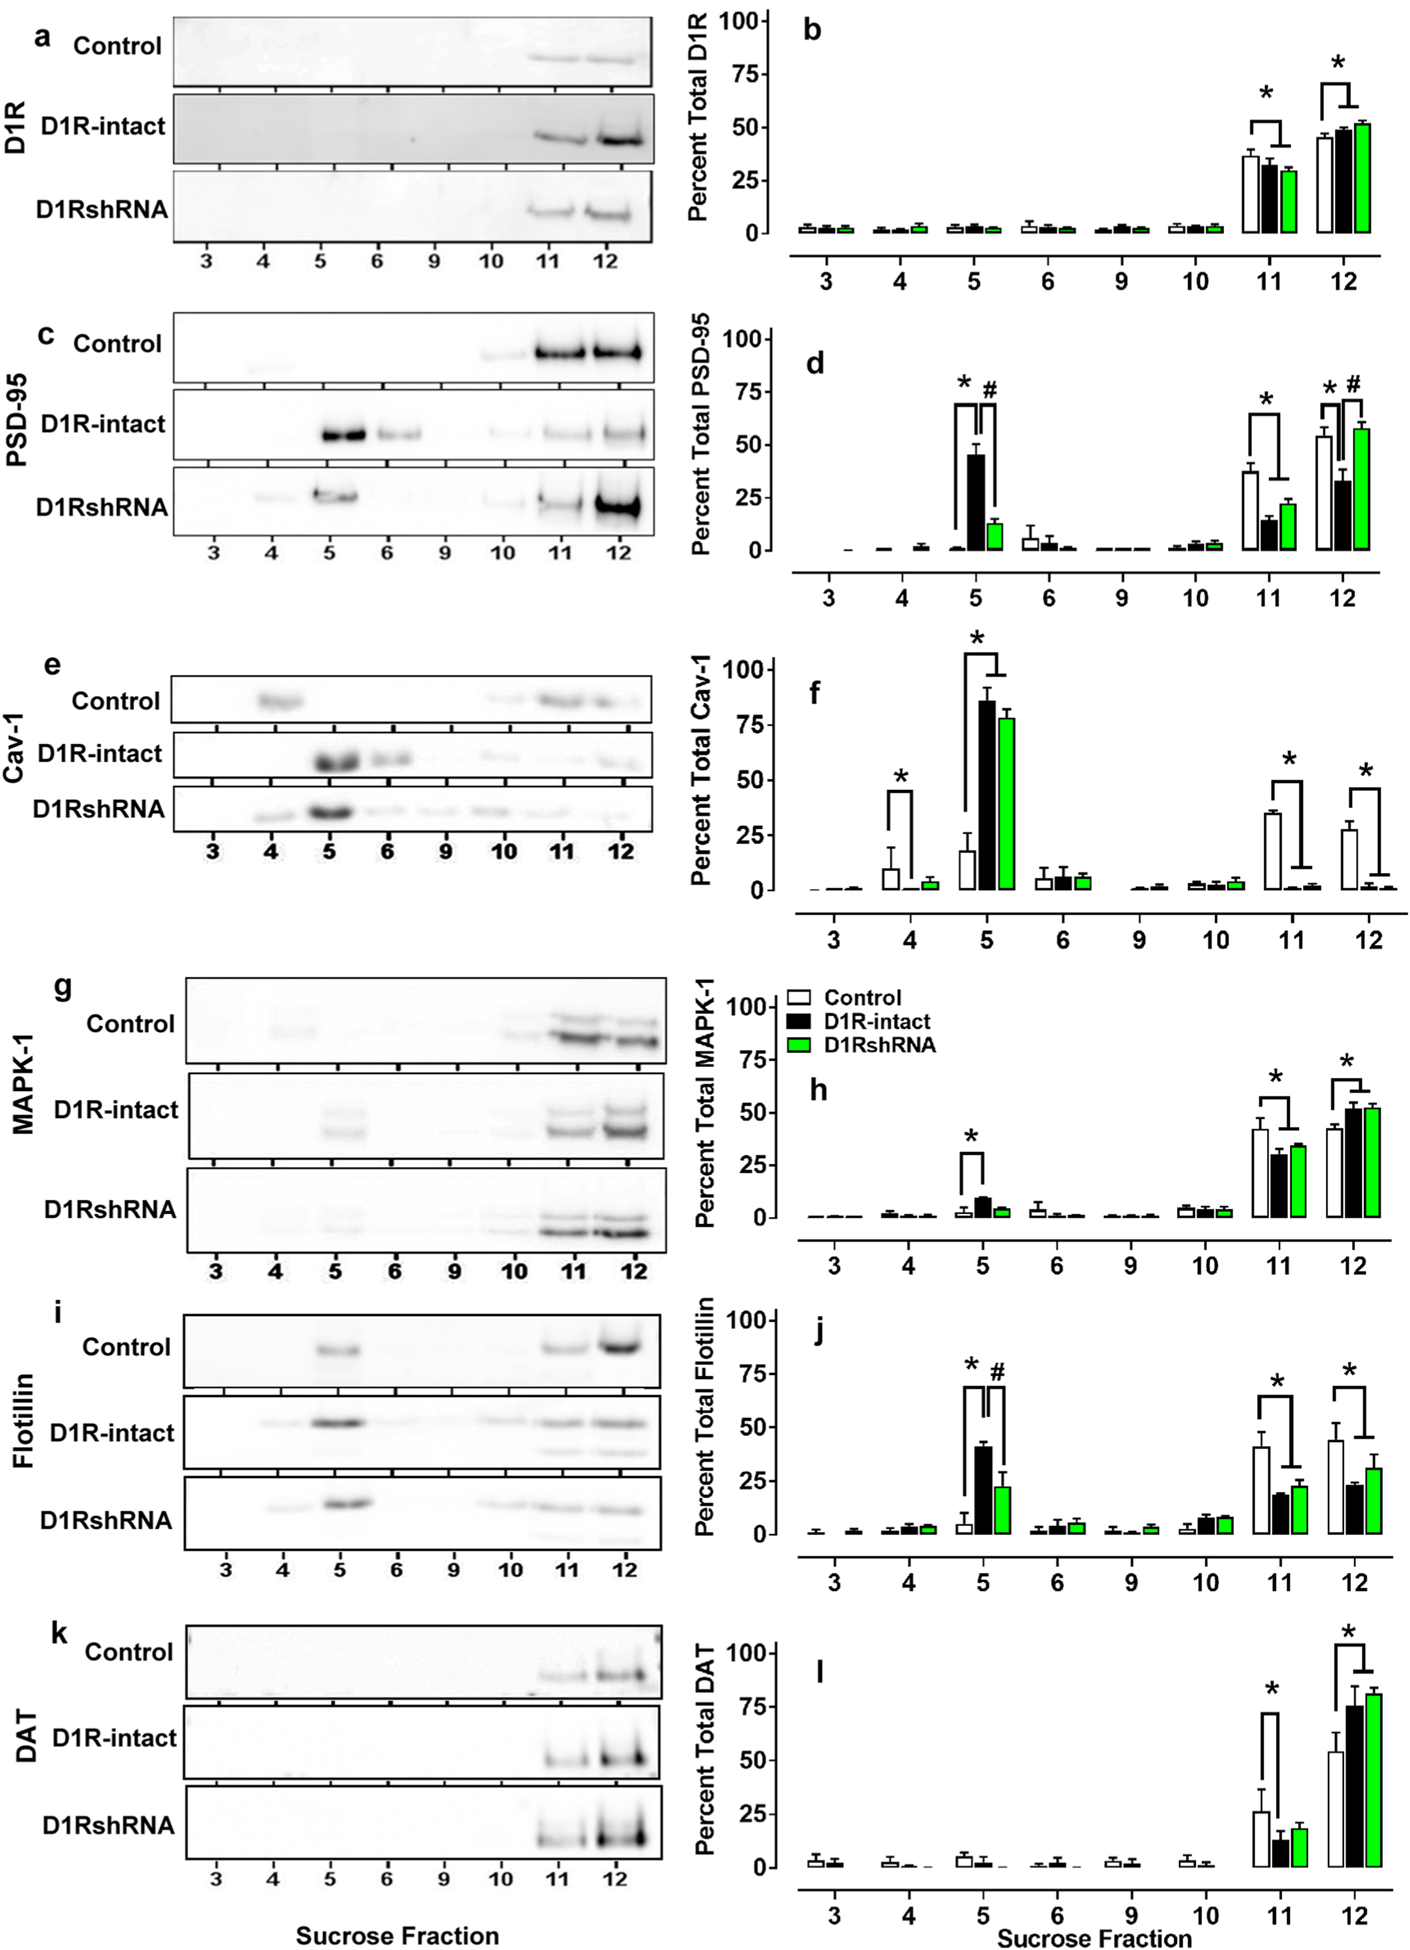
Fig. 5.

Representative immunoblots (a, c, e, g, i, k) and quantitative analysis (b, d, f, h, j, l) of the various proteins used for sucrose density gradient fractionation analysis from methamphetamine and behavior- and virus-naïve control rats. *p < 0.05 vs. controls, #p < 0.05 vs. D1R-intact rats by ANOVA followed by post hoc analysis. n = 4 in each group
