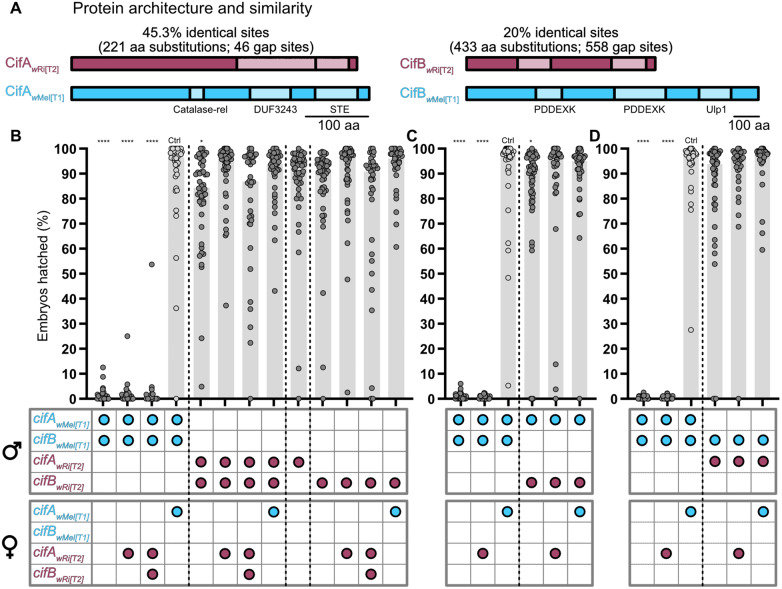
Figure 4.
CifwRi[T2] protein similarity and results of transgenic crosses including CifwRi[T2] proteins. (A) Protein architecture of CifwMel[T1] and CifwRi[T2] (Lindsey et al. 2018). In an alignment of CifAwMel[T1] and CifAwRi[T2] (488 aa), there are 221 identical sites, 221 aa substitutions, and 46 gap sites. In an alignment of CifBwMel[T1] and CifBwRi[T2] (1239 aa), there are 248 identical sites, 433 aa substitutions, and 558 gap sites. Specific details on the kinds and locations of sequence variations are illustrated in Supplementary Figure S5. Hatch rate analyses testing (B) cifAwRi[T2], cifBwRi[T2], and cifA;BwRi[T2] for CI and rescue (N = 35–55 where each dot represents a clutch of embryos from a single mating pair), (C) cifAwMel[T1];cifBwRi[T2] for CI (N = 39–56), and (D) cifAwRi[T2];cifBwMel[T1] for CI (N = 31–45). Horizontal bars represent median embryonic hatching from single pair matings. Genotypes for each cross are illustrated below the bars where the genes expressed in each sex are represented by colored circles. Blue circles represent cifwMel[T1] genes and purple circles represent cifwRi[T2] genes. All flies were uninfected with Wolbachia. Each hatch rate contains the combined data of two replicate experiments, each containing all crosses shown. Asterisks above bars represent significant differences relative to a control transgenic rescue cross (denoted Ctrl) with an α = 0.05. *P < 0.05, **P < 0.01, ***P < 0.001, ****P < 0.0001. Exact P-values are provided in Supplementary Table S1.

