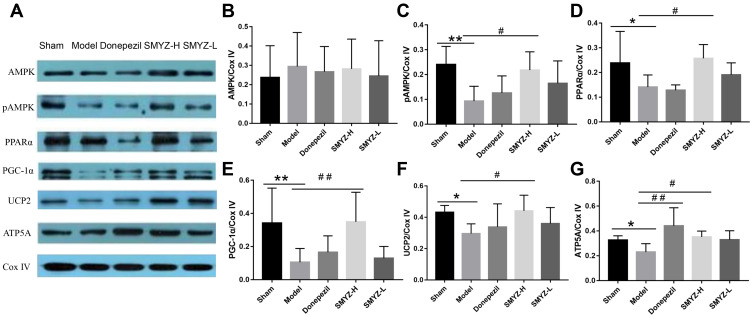
Figure 8.
WB protein expression bands in each group (A) Comparison of AMPK (B), pAMPK (C), PPARα (D), PGC-1α (E), UCP2 (F), and ATP5A (G) protein expression in each group. *P < 0.05 compared with the sham group; #P < 0.05 compared with the model group; **P < 0.01 compared with the sham group; ##P < 0.01 compared with the model group. (n=5).

