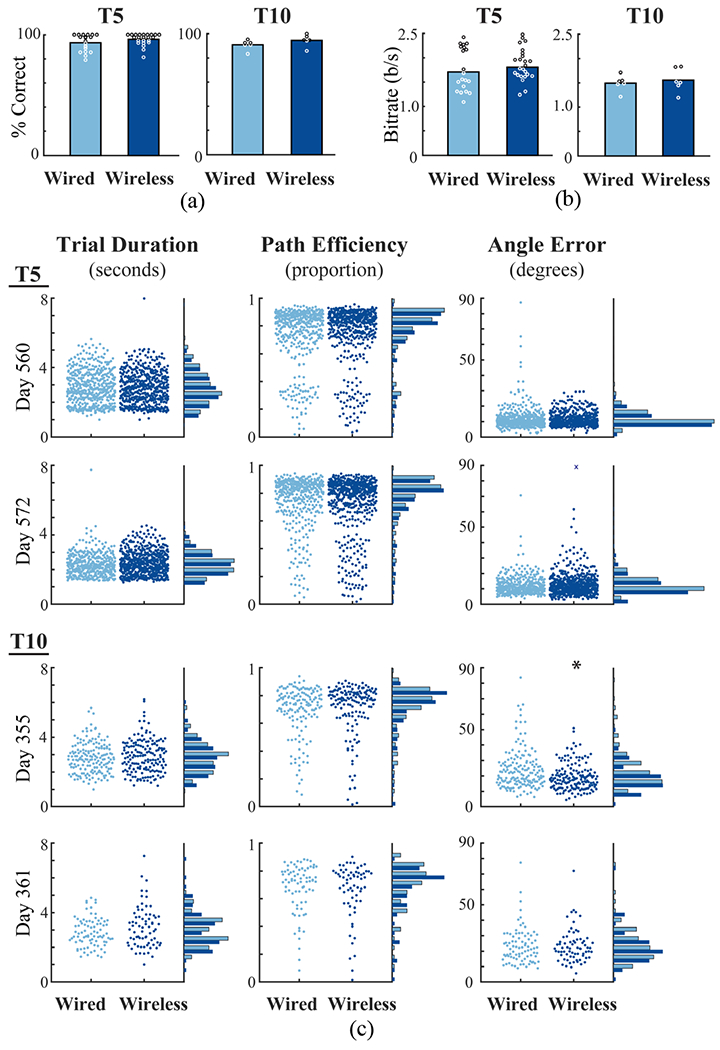
Fig. 3.

Metrics comparing closed-loop cursor control in wired (light blue) and wireless (dark blue) configurations. (a) Median target acquisition rates in wired and wireless conditions. Circles indicate the measure for each iteration of the Grid Task across two sessions for each participant (white and black used for contrast). (b) Bitrates in wired and wireless conditions (one measure for each Grid Task across two sessions for each participant). (c) Three metrics of cursor control over two days for each participant. Each point shows the metric computed for an individual trial (one target acquisition). Points are spread on each X-axis to reveal individual trials. Histograms on the right of each plot summarize wired and wireless performance. ‘x’ indicates an angle error exceeding 90 degrees. ‘*’ indicates significant difference (P<0.05).
