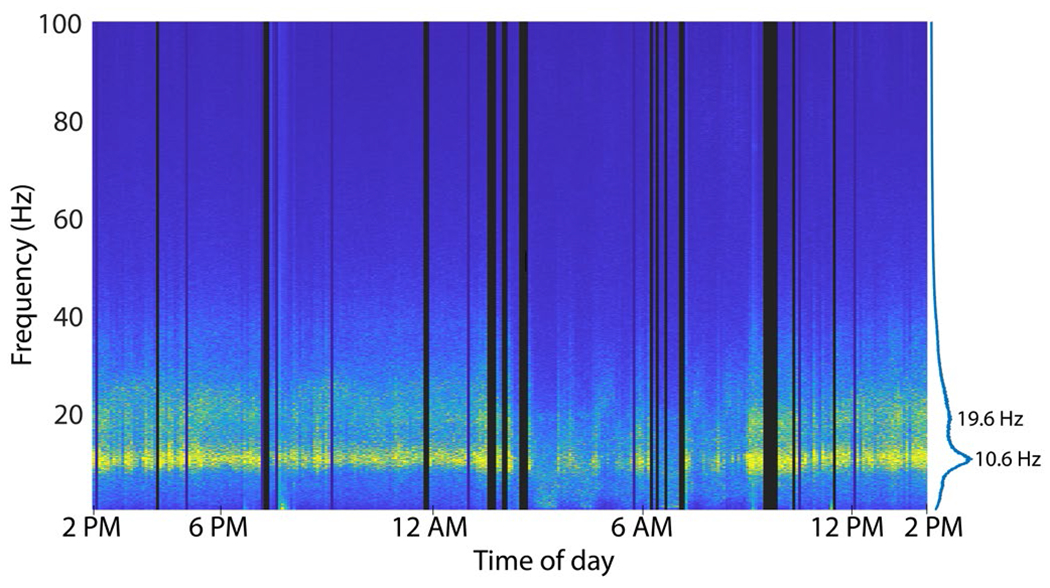
Fig. 4.

Spectral content of T10 neural data recorded continuously over 24 hours with the wireless system (posterior pedestal). X-axis indicates wall-clock time. Dark vertical bars reflect periods where data was not recorded (e.g., transmitters removed) or was severely disrupted (high frame loss). Peaks in the spectral power are noted on the right at 10.6 Hz and 19.6 Hz.
