
Fig. 5.
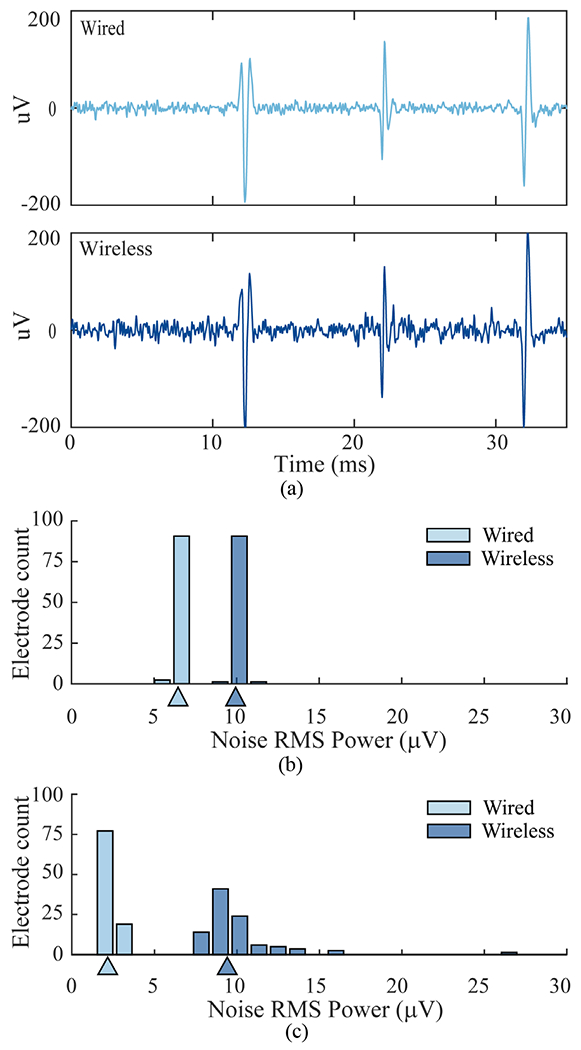
Comparison of wired and wireless recordings of simulated neural signals, (a) Waveforms of three different spiking neurons aligned from bandpass-filtered wired and wireless recordings, (b) Distribution of baseline noise in the spike-filtered data (250 Hz – 7.5 kHz) across all 96 channels. Noise was measured as RMS power of the residual signal after all spike events were removed. Triangles indicate median noise values, (c) Distribution of noise values in the field potential range (5 Hz – 250 Hz) computed for each channel after removing the 96-channel mean signal recorded in the wired condition.