
Fig. 6.
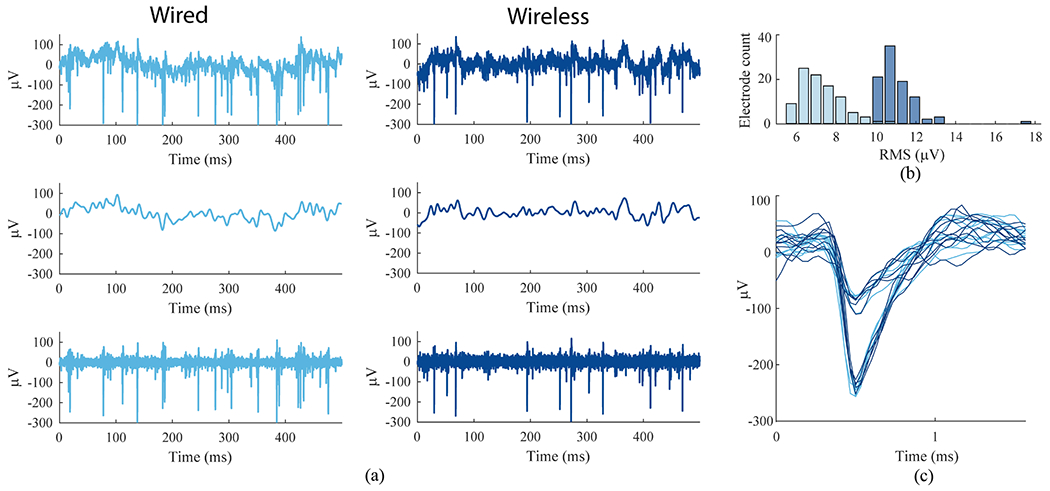
Human intracortical signals recorded in wired and wireless configurations in the home, (a) Comparison of recorded neural activity on one electrode (t10 trial day 361, e24 blocks 6, 7). Top: the “raw” unfiltered neural signal. Middle: low-pass filtered (100 Hz cutoff). Bottom: band pass filtered for spike extraction (250 Hz — 7.5 kHz). (b) Distribution of residual RMS amplitudes from all electrodes on one array after band-pass filtering and removing thresholded spikes for wired (light blue) and wireless (dark blue) recordings, (c) Sample waveforms from two units sorted from the same electrode shown in (a) and (b). Light blue (wired) and dark blue (wireless) waveforms show substantial similarity.