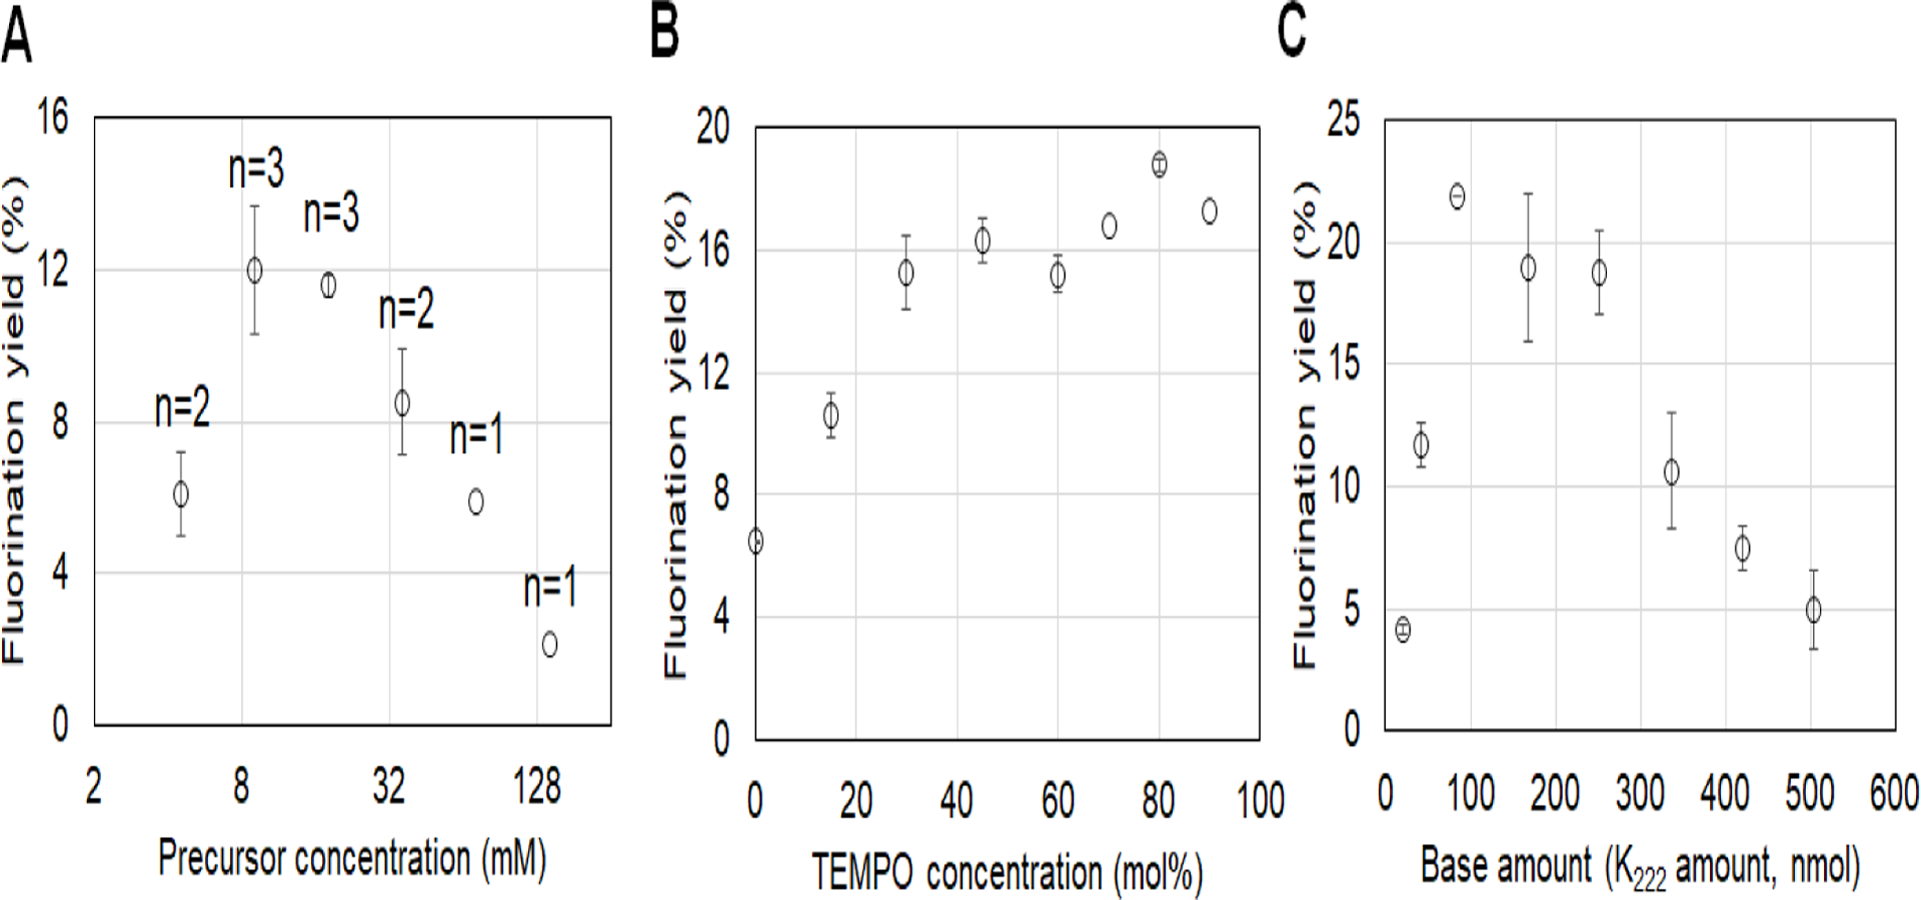
Figure 4.

Optimization of microdroplet synthesis of [18F]FDOPA using the manual setup. (A) Effect of precursor concentration. (B) Effect of TEMPO concentration. n=2 for all points except 70 and 90% mol% (where n=1). (C) Effect of base amount, represented by K222 amount (K2CO3 amount is 2.05x lower). n=2. In all plots, data points represent averages and error bars represent standard deviations.
