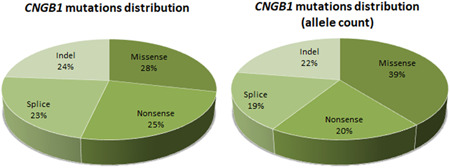
Figure 2.

Pie charts showing the distribution of the CNGB1 variants underlying inherited retinal diseases according to their types. On the left, the absolute distribution is shown. On the right, the distribution according to the allele count performed through the revision of the literature and the analysis of the cohort in this study is shown
