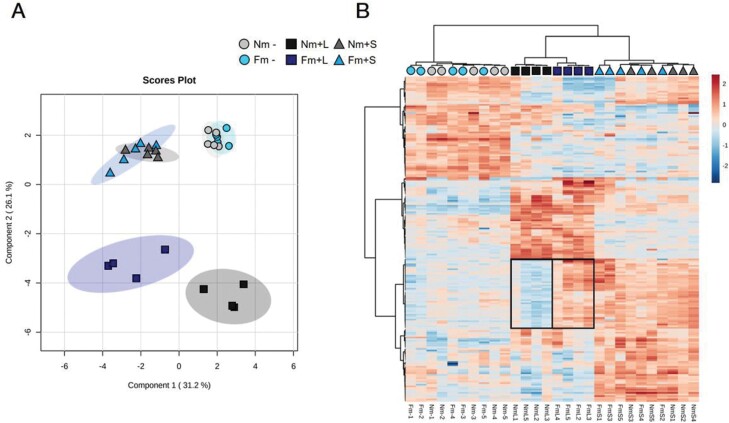
Fig. 3.
Overview of the metabolomic reprogramming in tomato leaves subjected to Spodoptera exigua feeding for 15 days. Six weeks old tomato plants non-mycorrhizal (Nm) or colonized by the arbuscular mycorrhizal fungi Funneliformis mosseae (Fm) were infested with S. exigua second instar larvae, and leaves were harvested after two weeks of systemic herbivory. Lyophilized leaf material from control non-infested plants (-), infested leaflets (local response to herbivory, +L) and non-damaged leaflets from infested plants (systemic response to herbivory, +S) were analysed through ultra-high performance liquid chromatography interfaced with a quadrupole time-of-flight mass spectrometer (UPLC-Q-TOF-MS), in order to monitor metabolomic changes. Signal intensity was determined in all samples after normalizing the chromatographic area for each compound to the dry weight of the sample. All 1132 registered signals (Supplementary Table S1), from combination of both positive and negative electrospray ionization (ESI), were compared using non-parametric Kruskal–Wallis test, and only data with significant differences between groups at P<0.05 were used for the supervised analysis (n=5 for - and +S, n=4 for +L), obtaining 200 signals (Supplementary Table S2). Grey and blue colour scales represent Nm and Fm treatments, respectively, and for each case, circles represent non-stress (-), dark coloured squares represent changes in infested, damaged tissue (L), and triangles represent changes in systemic responses to herbivory (S). (A) Supervised three-dimensional sparse partial least squares discriminant analysis (sPLSDA) representation of the major sources of variability. (B) Heatmap and clustering representation of the 200 signals showing differences among treatments. Cluster of metabolites showing an over-accumulation pattern upon herbivory in L tissue only in Fm plants (priming pattern) is highlighted.

