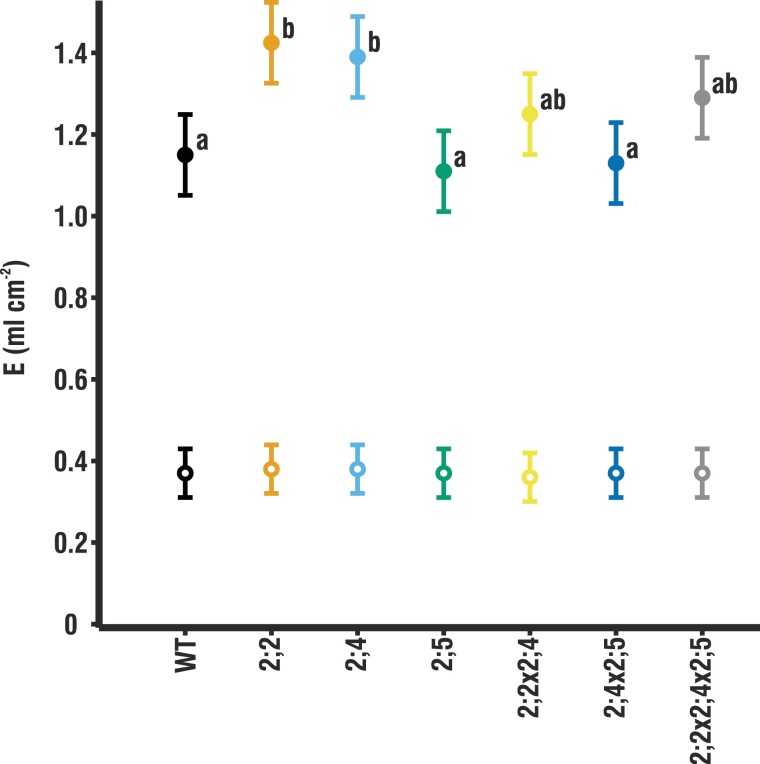
Fig. 2.
Whole-plant transpiration in terms of cumulative leaf area under low and high humidity. Transpiration is shown under low humidity (LH; filled circles) and high humidity (HH; open circles) over the course of 30 d (n=10–16). Given are means ±pooled SE. Whole-plant transpiration data as well as the SE of each individual genotype are shown in Supplementary Table S2. Letters indicate statistically significant differences between mutants. No significant differences were found under HH.

