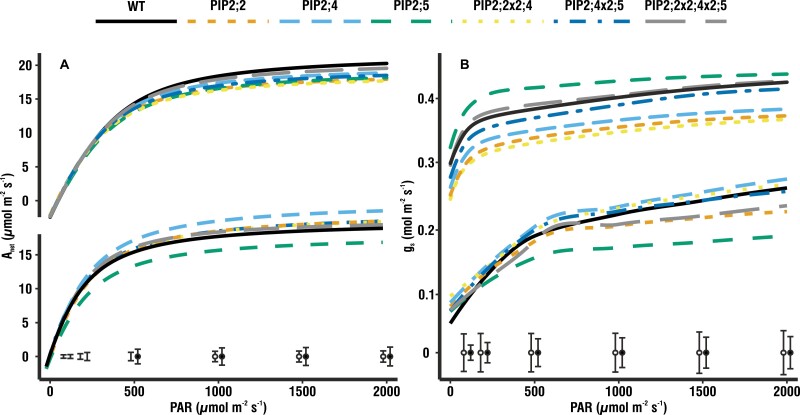
Fig. 4.
Light–response curves. (A) Light–response curves measured under high humidity (HH; above, n=9–11) and low humidity (LH; below, n=4–7) showing the rate of photosynthesis in response to increasing radiation. Asat reaches similar values under both growing conditions. Under LH, the pip2;5 mutant stands out, displaying 13% lower Anet compared with the wild type (WT). Pip2;4 showed the opposite trend, with 21% higher Anet compared with the WT. (B) Light–response curves measured under HH (above, n=9–11) and LH (below, n=4–7) showing gs in response to increasing radiation. Under HH, gs is clearly higher and much more stable over the entire range of irradiances. Under LH, pip2;5 displayed a much slower and 5% smaller response of gs compared with the WT. Pip2;4 showed 19% higher gs compared with the WT. Fitted means with the pooled SE at each measuring point under HH (open circles) and LH (filled circles) are given at the bottom of the graph.

