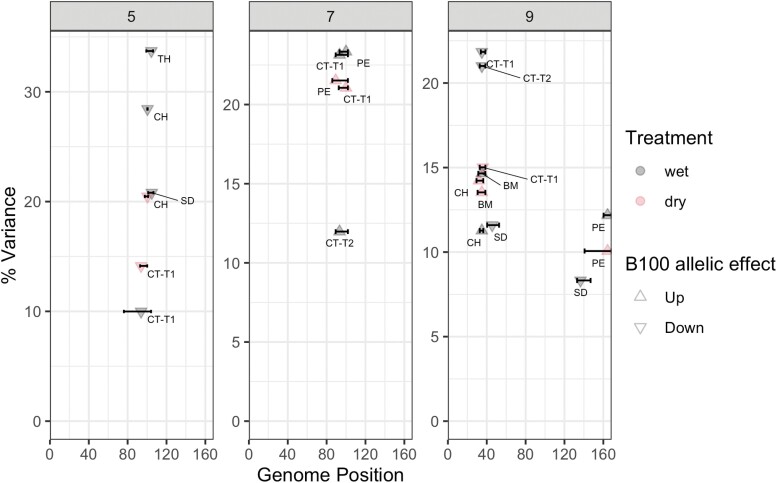
Fig. 7.
QTL identified for stomatal density (SD) and canopy temperature at 30 DAS (CT-T1) and 32 DAS (CT-T2), total biomass (BM), panicle emergence (PE), culm height (CH), and tiller height (TH) under wet (gray) and dry (pink) treatments in the Setaria RIL population. Each panel corresponds to a chromosome. The arrows indicate the direction of the B100 allelic effect.

