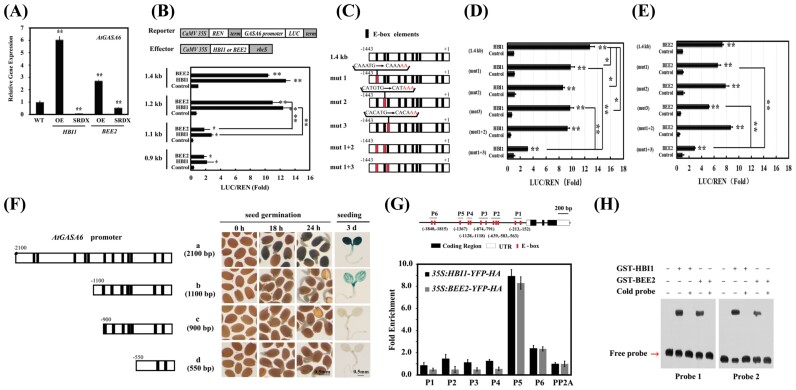
Fig. 3.
HBI1 and BEE2 regulate GASA6 expression by binding to the E-box-like elements in vivo and in vitro. (A) Transcript levels of GASA6 in HBI1- or BEE2-OE and SRDX lines measured using quantitative RT-PCR (qRT-PCR). Data were normalized to UBQ1. (B) Transactivation of the full-length and truncated GASA6 promoter–reporters by HBI1 or BEE2 in Arabidopsis protoplasts. Various constructs used in transient expression assays are shown in the upper panel. (C) Schematic diagram of the 1.4 kb GASA6 promoter with all E-boxes (black) and mutated E-boxes (red) used in (D) and (E). Transactivation of the GASA6 promoter and its mutants by HBI1 (D) or BEE2 (E) in Arabidopsis protoplasts. (F) Schematic diagram of different fragments of the GASA6 promoter (left); the numbers indicate the promoter length. Analysis of GUS activities in different pGASA6::GUS lines (right). Scale bar=0.5 mm. (G) Schematic diagram of the GASA6 promoter. P1 to P6 indicate fragments used for chromatin immunoprecipitation-quantitative PCR (ChIP-qPCR) amplification. ChIP-qPCR analysis of HBI1-HA or BEE2-HA binding to the GASA6 promoter upon precipitation with anti-HA antibody. Five-day-old 35S::HBI1-YFP-HA, 35S::BEE2-YFP-HA, or WT seedlings were used in ChIP-qPCR. Fold enrichments indicate the enrichment of HBI1-HA or BEE2-HA binding to the GASA6 promoter compared with that of the WT. Data represent the mean ±SE of three replicates. (H) EMSA of HBI1 or BEE2 after incubation with biotin-labeled DNA probes containing the E-box sequences of the GASA6 promoter (Probe1 and Probe2). In competition experiments to demonstrate the specific binding of proteins to the probes, non-labeled probes (cold probes) were added in 1000-fold excess of the labeled probes. Values represent the mean ±SE of at least four biological replicates. Except when specifically indicated, asterisks indicate significant differences compared with control (one-way ANOVA was used to analyze the significant differences). *P<0.05; **P<0.01.

