Figure 2.
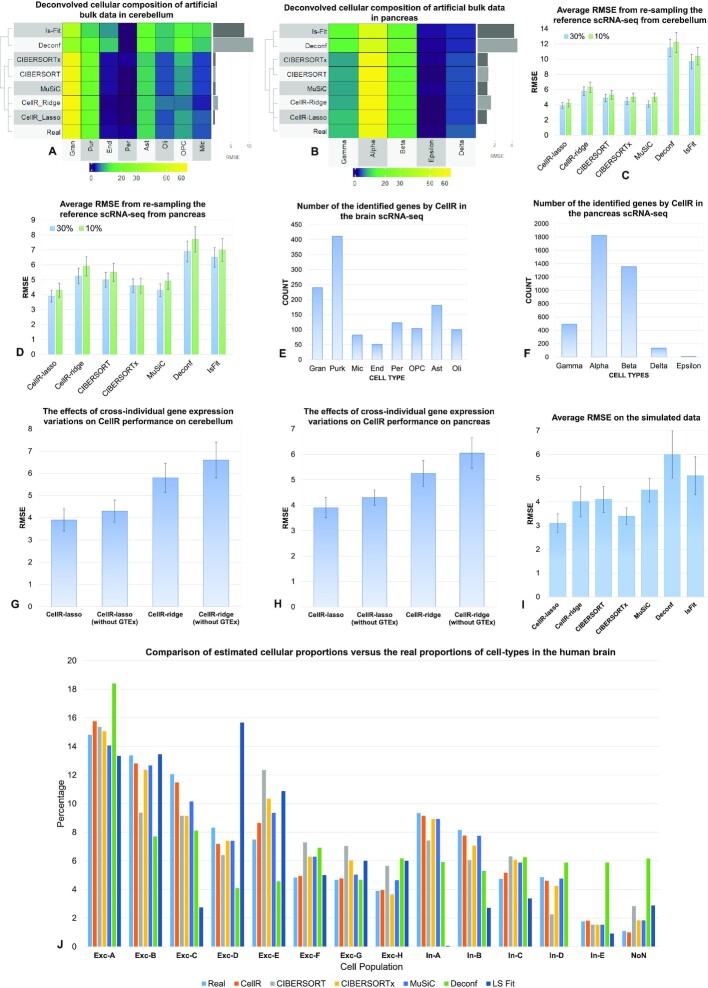
Comparative analysis of CellR and four other competing approaches. (A) Output of the compared methods using the artificial bulk RNA-seq data on cerebellum. (B) Output of the compared methods using the artificial bulk RNA-seq data on pancreas. (C) Average RMSE of re-sampling from the reference scRNA-seq data from cerebellum to compare stability of each method at 10% and 30% number of cells re-sampled. (D) Average RMSE of re-sampling from the reference scRNA-seq data from pancreas to compare stability of each method at 10% and 30% number of cells re-sampled. (E and F) Number of the identified cell-specific markers in brain and pancreas, respectively. (G and H) The effects of removing GTEx information from CellR on the accuracy of the results on cerebellum and pancreas data, respectively. (I) Average RMSE on the independent simulated data. (J) Comparison results of the competing methods compared to the ground truth data in human brain.

