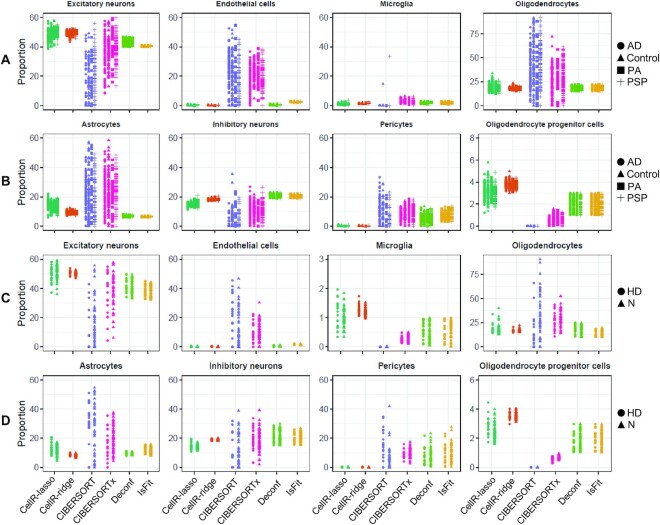
Figure 3.
Cellular proportions of AD and HD cohorts. (A) Output of the compared methods using the bulk data from AD samples generated from human brain tissues for Exc, End, Mic and Oli cells. (B) Output of the compared methods using the bulk data from AD samples generated from human brain tissues for Ast, In, OPC and Per cells. (C) Output of the compared methods using the bulk data from HD and normal (N) samples generated from human brain tissues for Exc, End, Mic and Oli cells. (D) Output of the compared methods using the bulk data from HD and normal (N) samples generated from human brain tissues for Ast, In, OPC and Per cells. N: normal healthy controls; PSP: progressive supranuclear palsy, PA: pathologic aging, Exc: excitatory neurons, In: inhibitory neurons, Ast: astrocytes, OPC: oligodendrocyte progenitor cells, Per: pericytes, End: endothelial cells, Mic: microglia, Oli: oligodendrocytes.

