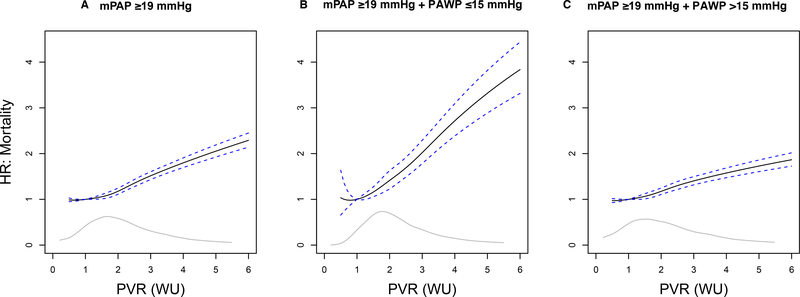
Figure 1. The adjusted hazard ratio for all-cause mortality stratified by pulmonary vascular resistance (PVR) in patients with elevated pulmonary artery pressure.
From the primary cohort, the hazard ratio (95% confidence interval) for all-cause mortality is plotted for PVR 1–6 WU relative to a reference value of 1.0 WU in patients with mean pulmonary artery pressure ≥19 mmHg (A). This population was then restricted to PAWP ≤15 mmHg (B) and, alternatively, to PAWP >15 mmHg (C). WU, Wood unit. The grey line inset is the kernel density estimate, representing the relative density of patients across PVR levels.

